Introduction to Teaming Analytics™ Report
Expand to read the introduction & how to interpret this report
Introduction
This report delivers a multi-dimensional analysis of teaming dynamics observed during your Teaming Mission, structured across two key stages:
- Mission Simulation – A high-stakes, uncertain environment that challenges the team’s ability to make decisions under pressure.
- Mission Retrospective – A structured, reflective process where the team extracts insights to enhance future teaming capabilities.
By leveraging data-driven metrics, this report reveals patterns and imbalances that shape team effectiveness, offering actionable insights to strengthen intelligent teaming.
Objectives
The Teaming Dynamics Analysis Report is designed to:
- Connect Performance and Reflection – Bridge the simulation phase (focused on real-time performance and decision-making) with the retrospective phase (focused on reflection, learning, and effectiveness).
- Uncover Communication Patterns – Identify trends, imbalances, and engagement levels in team interactions across both contexts.
- Enhance Team Awareness – Provide actionable insights into factors that influence communication, collaboration, reflection, problem-solving, and decision-making, fostering a shared understanding of team dynamics.
Interpreting the Results
This report examines team dynamics across two distinct contexts, each requiring careful interpretation of the graphs. During the simulation, dominant dialogue may reflect effective leadership, role-driven responsibilities, or urgent decision-making. In contrast, during the retrospective, similar dominance could indicate over-assertiveness or disengagement from other team members. Recognizing these distinctions helps ensure that insights are accurately interpreted and lead to meaningful improvements in team performance.
Best Practices for Interpretation
- Context Matters – Assess communication patterns within the appropriate context. A leadership-driven dynamic in a simulation may be expected, while balanced participation is preferable in a retrospective discussion.
- Identify Imbalances – Large disparities in participation, inquiry, or turn-taking may indicate barriers to inclusivity and collaboration. Look for opportunities to foster more balanced contributions.
- Focus on Trends – Consistent behaviors (e.g., dominance, disengagement) over time are more informative than isolated instances. Identifying patterns helps teams make targeted adjustments.
- Combine Metrics – Use multiple data points together for a more holistic understanding of team interactions. No single metric tells the full story.
Teaming Analytics™ Report Summary
| Theme / Metric | Description | Score (1-5) |
Summary | Considerations |
|---|---|---|---|---|
| ◆ Participation | Did team members share airtime and turns equitably? | 3 | ⚖️ Some imbalance but acceptable | Typical imbalance; still room to widen voices. |
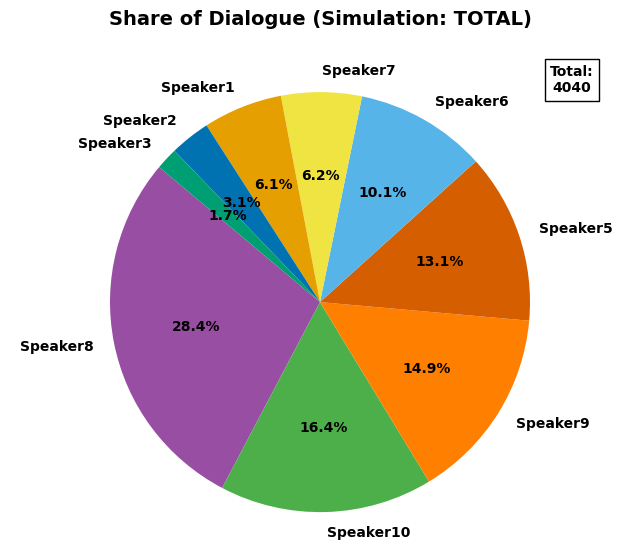
| Share of Dialogue | How evenly does everyone talk? | 3 | ⚖️ Moderate – some imbalance, most contribute | Some imbalance is common under time pressure. As long as others remain engaged, moderate variance may be acceptable. |
| Turn-Taking | How fairly are turns shared? | 2 | 🚧 Uneven – noticeable hogging of turns | High variability might be necessary for rapid decisions but may marginalize quieter voices. |
| ◆ Flow | Was the conversation fluid and responsive? | 3 | ⚖️ Reasonable flow; minor bottlenecks | Flow serviceable; watch for monopolies. |
| Conversation Patterns | Smoothness of speaker transitions? | 4 | ✅ Smooth flow – few disruptions | Flow is occasionally smooth but often disrupted by imbalances in who speaks and how often they hand off. |
| Network Analysis | How often do speakers respond to one another? | 4 | ✅ Strong – most links are mutual | Broad and mutual exchanges suggest a responsive network that supports agile and adaptive problem-solving. |
| Speaking Transitions Heatmap | How many speaker pairs interact? | 3 | ⚖️ Mixed – about half the pairs link up | Partial coverage can support task flow, but creative recombination of insights is restricted. |
| ◆ Consistency | Was engagement steady from start to finish? | 3 | ⚖️ Moderately steady | Some quiet segments; monitor balance. |
| Contributions Over Time | How steady is participation throughout? | 3 | ⚖️ Some consistency – gaps noticeable | Mixed pacing is common in simulations; contributions remain acceptable if key voices are not missed. |
| Turn-Taking Over Time | Turn balance from start to finish? | 2 | 🚧 Unsteady – big swings in turn balance | Noticeable inconsistency in pacing and speaker presence may reflect tactical pushes but risks narrow input. |
| Turn Duration | How similar are average turn lengths? | 2 | 🚧 Uneven – noticeable length gaps | Wide differences in turn pacing suggest a lack of structure; urgency may justify it, but agility suffers. |
| ◆ Curiosity | Were questions used to explore and learn? | 3 | ⚖️ Moderate curiosity | Healthy mix; can deepen further. |
| Questions to Statements | How often are questions asked vs. statements? | 3 | ⚖️ Moderate – healthy mix of asking/telling | A moderate questioning level shows some balance between directive communication and curiosity-driven exploration. |
| Balance of Inquiry | Balance of exploratory, reflective, assertive questions? | 2 | 🚧 Limited diversity – mostly two styles | Some variation appears, but one style still dominates—insufficient for navigating complex, high-pressure scenarios. |
| ◆ Language | Was the language constructive and diverse? | 4 | ✅ Positive tone & diverse words | Positive tone boosts morale. |
| Sentiment Analysis | Overall sentiment tone? | 4 | ✅ Positive – supportive tone | Mostly positive sentiment supports productive collaboration and psychological safety during decision-making. |
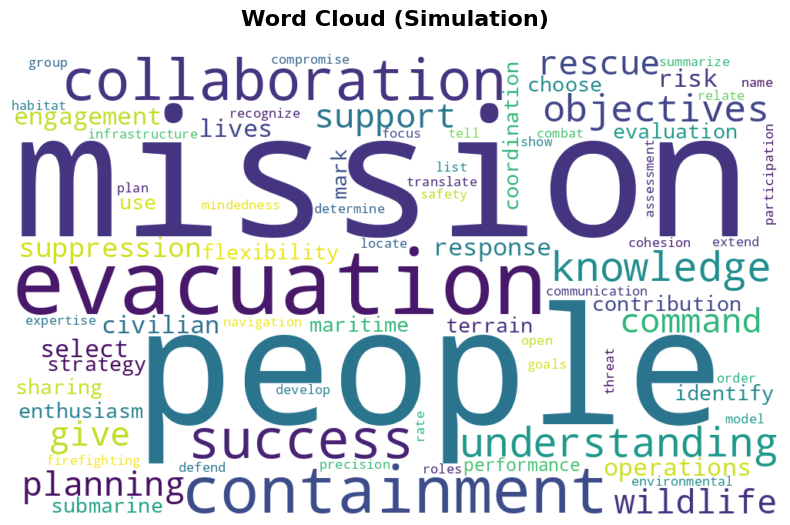
| Word Cloud | How varied is the vocabulary? | 3 | ⚖️ Moderate – mix of terms present | A moderately diverse vocabulary shows functional conversation, though broader exploration was possible. |
Word Cloud Analysis
Expand to read the description, relevance & probing questions
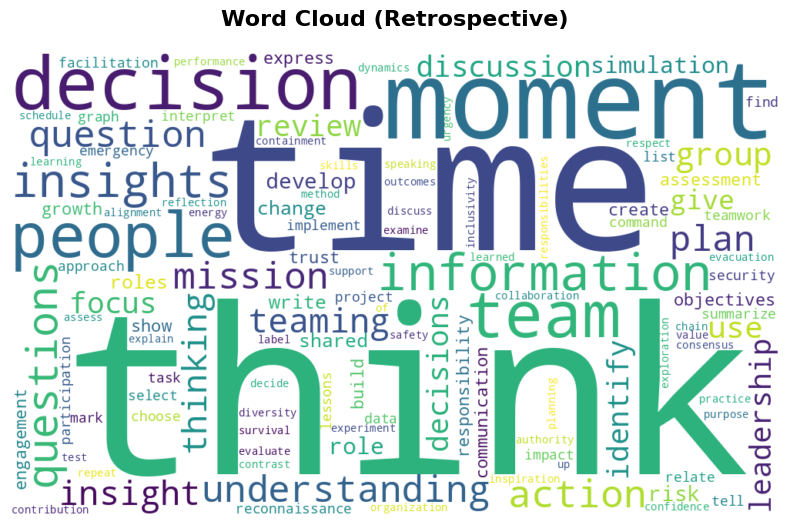
Description: The Word Cloud visualizes the most frequently used terms from the discussion. Larger words indicate higher frequency, offering insight into the team's key focus areas and priorities.
Relevance: Shared language is a cornerstone of effective teamwork. Research highlights that a common vocabulary enhances alignment, reduces misunderstandings, and strengthens cohesion. Teams with shared mental models communicate more efficiently, leading to better coordination and decision-making. The Word Cloud reveals alignment or gaps that may impact collaboration and trust.
Interpreting: To extract meaningful insights, consider the following:
- Identify Key Themes – Larger words reflect dominant topics, indicating shared priorities, concerns, or values.
- Assess Context – Terms used in the simulation phase may emphasize execution and urgency, while retrospective terms often highlight reflection and critique.
- Spot Gaps or Misalignment – Missing or unexpected terms may suggest differing perceptions or overlooked priorities.
Probing Questions:
- Individual Level
- Which words stand out to me? Why were they prominent?
- Are there words I expected but don't see? What might that indicate?
- Team Level
- Do the most common words reflect alignment or differing views?
- What tone do the words convey—urgency, caution, curiosity? How might this affect performance?
Share of Dialogue Analysis
Expand to read the description, relevance & probing questions
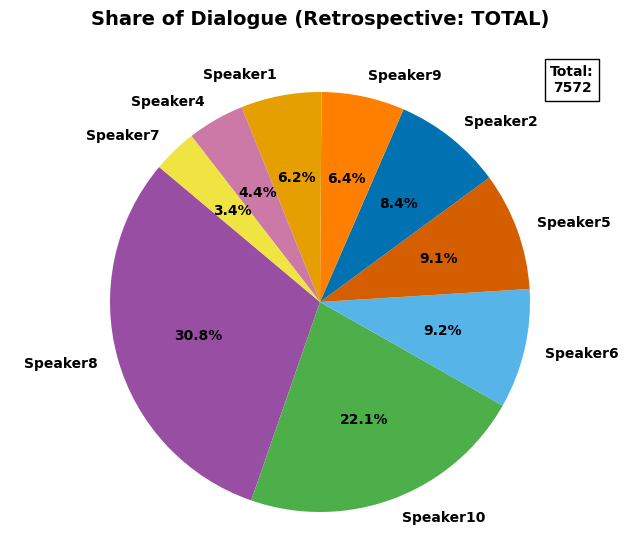
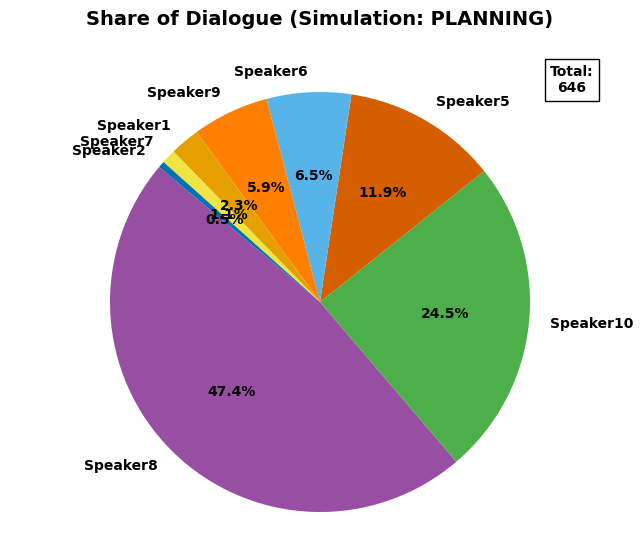
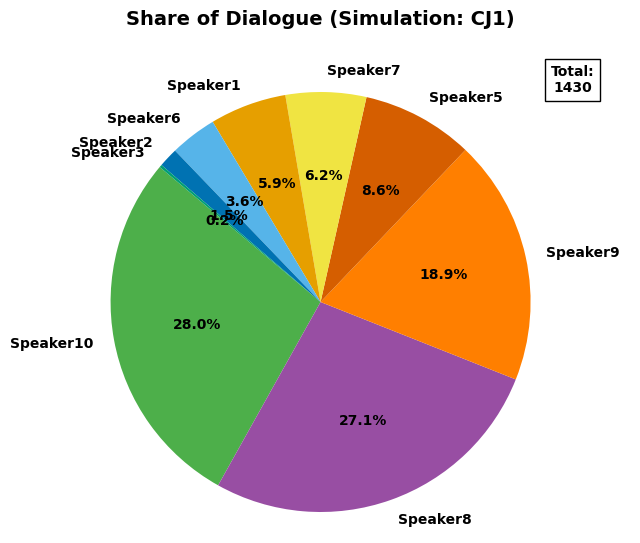
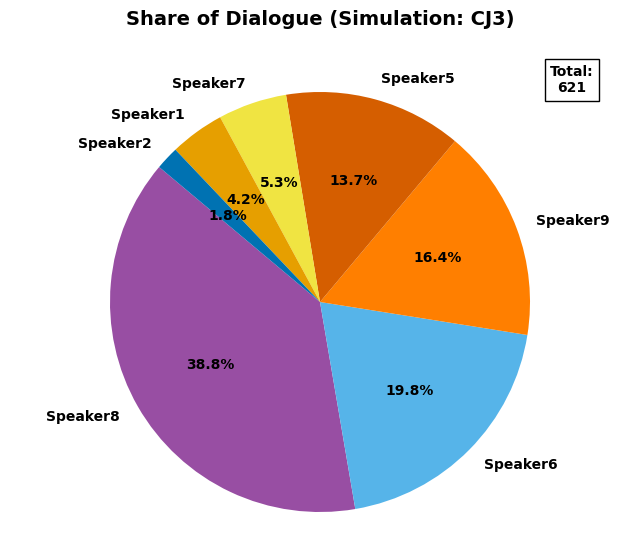
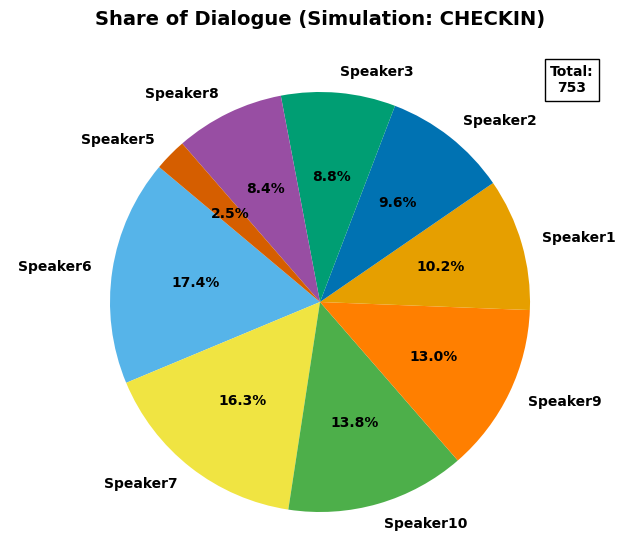
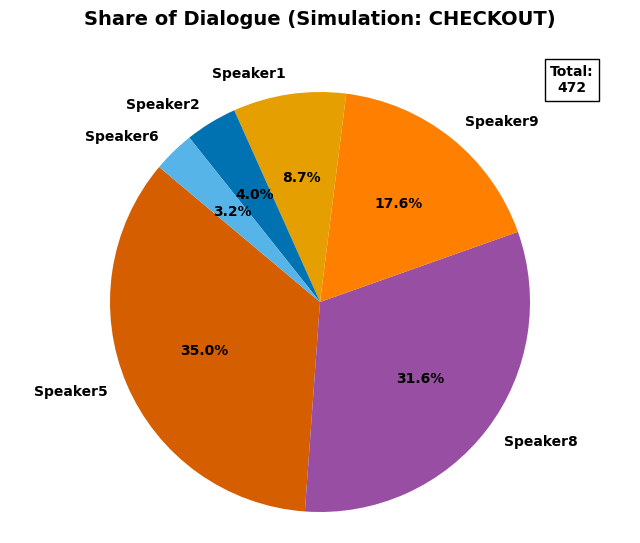
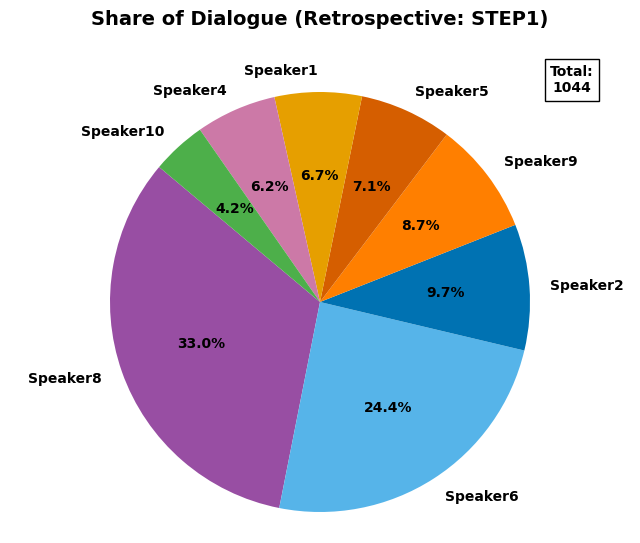
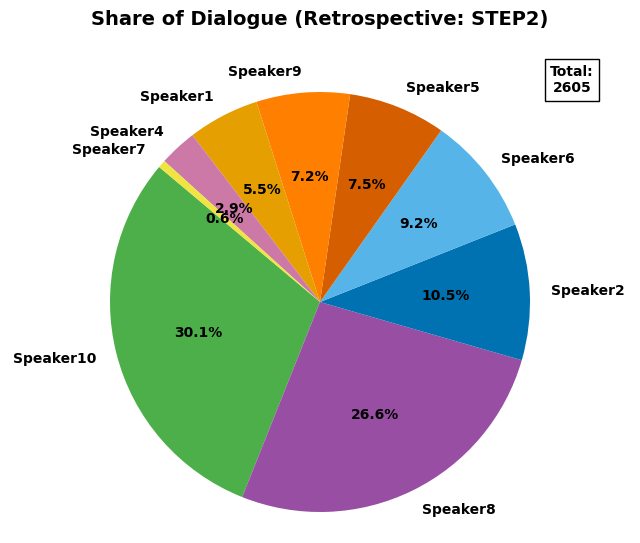
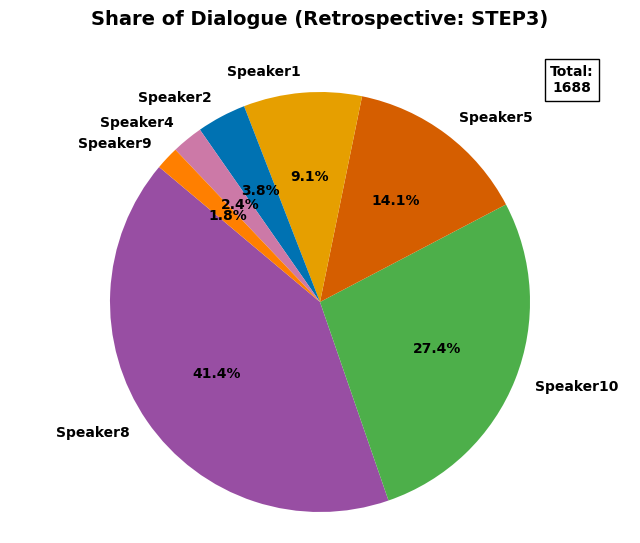
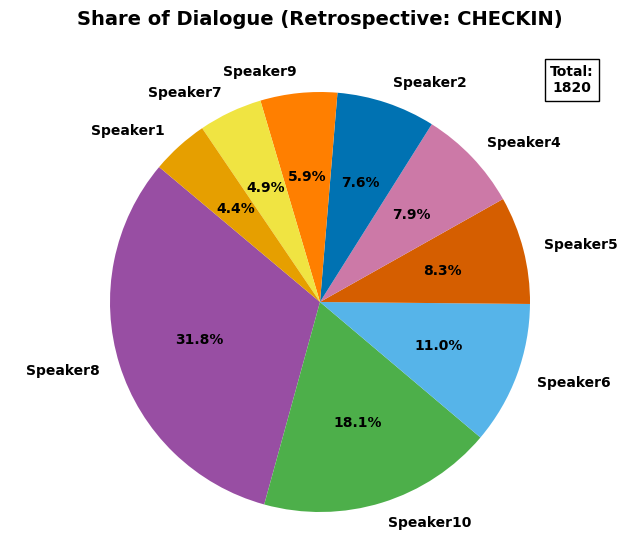
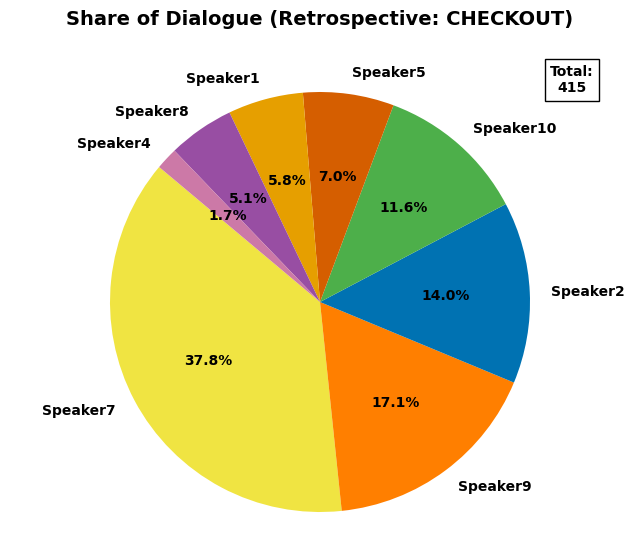
Description: The Share of Dialogue pie chart shows how much each participant spoke, based on word count. It highlights the distribution of verbal contributions and helps identify who led, followed, or remained quiet during the session.
Relevance: Balanced participation fosters inclusion, trust, and shared ownership. Research shows that high-performing teams often exhibit more even distribution of dialogue, allowing diverse ideas to surface and strengthening psychological safety. Uneven participation may signal dominance, disengagement, or role imbalances.
Interpreting:
- Evaluate Balance – Large disparities may point to dominant voices or silent contributors.
- Compare Contexts – Assertiveness in simulation might reflect leadership; similar dominance in reflection may hinder learning.
- Spot Consistency – Repeated imbalance across stages or phases may suggest systemic team dynamics worth exploring.
Probing Questions:
- Individual Level
- Did I speak more or less than others? Why?
- Was I heard—and did I hear others?
- Team Level
- Did we share airtime fairly?
- How did our speaking distribution affect collaboration and outcomes?
Turn-Taking Analysis
Expand to read the description, relevance & probing questions
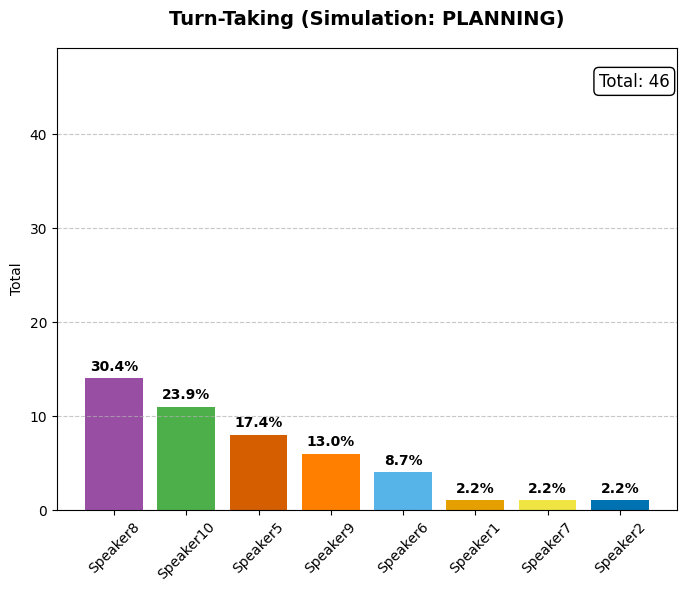
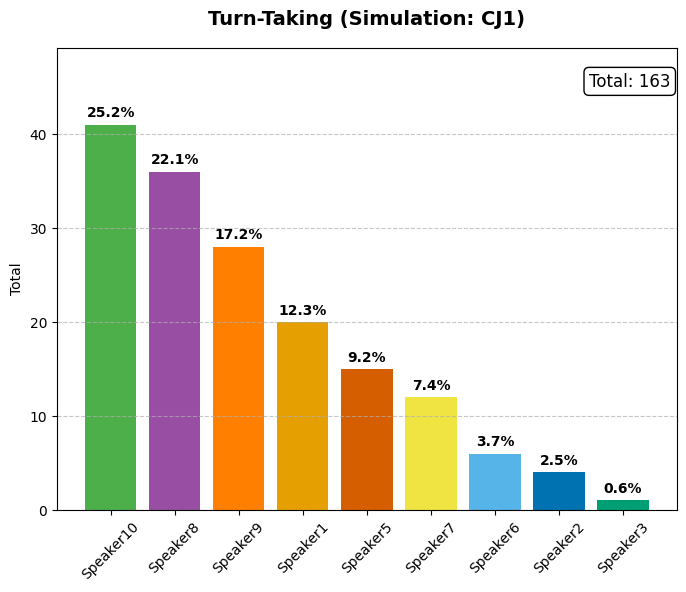
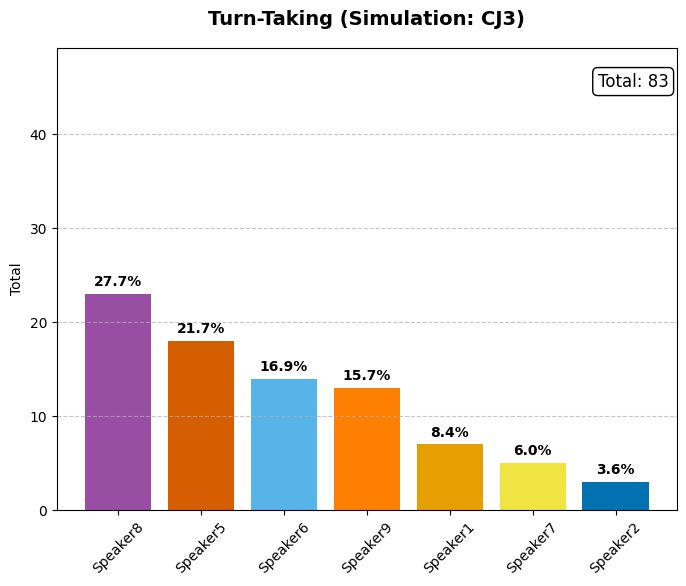
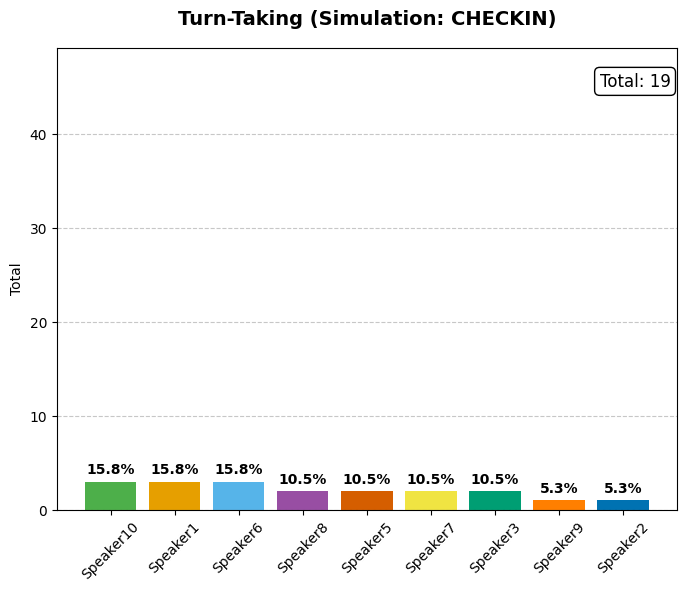
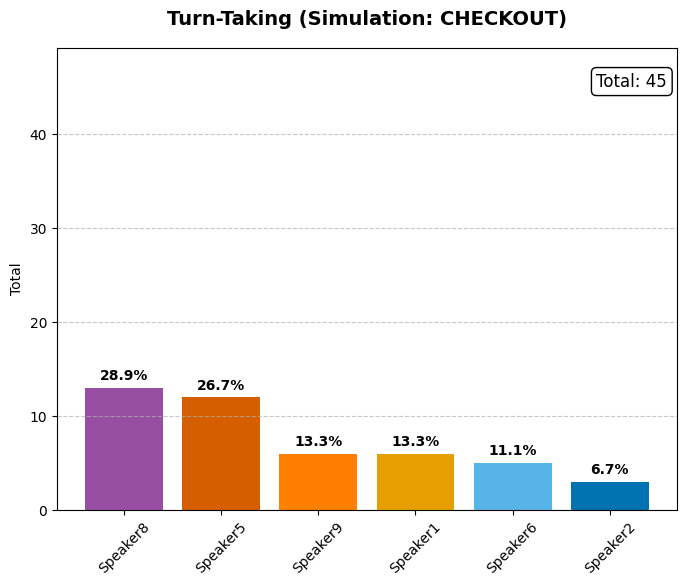
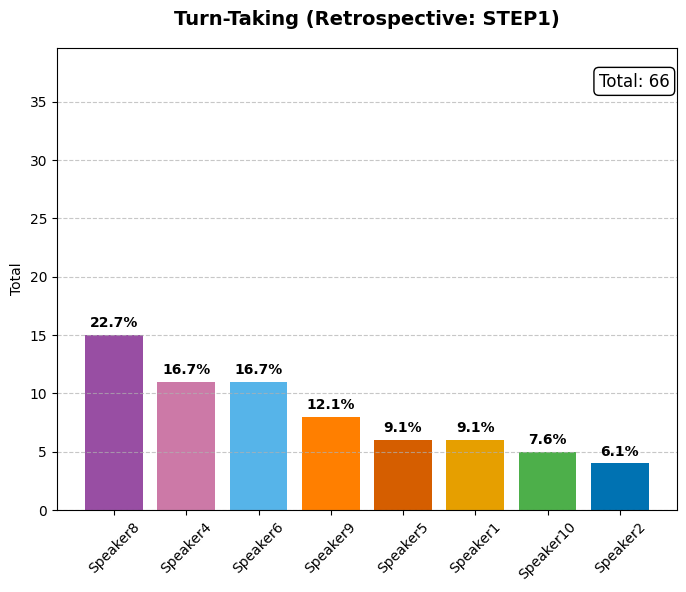
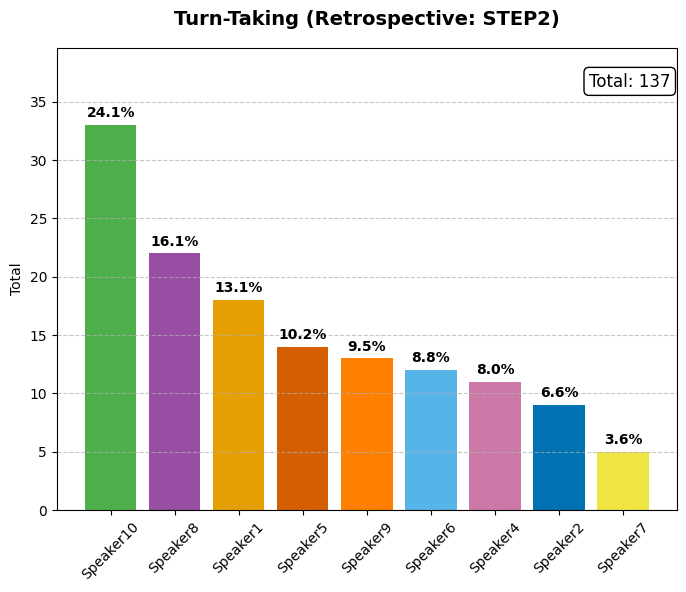
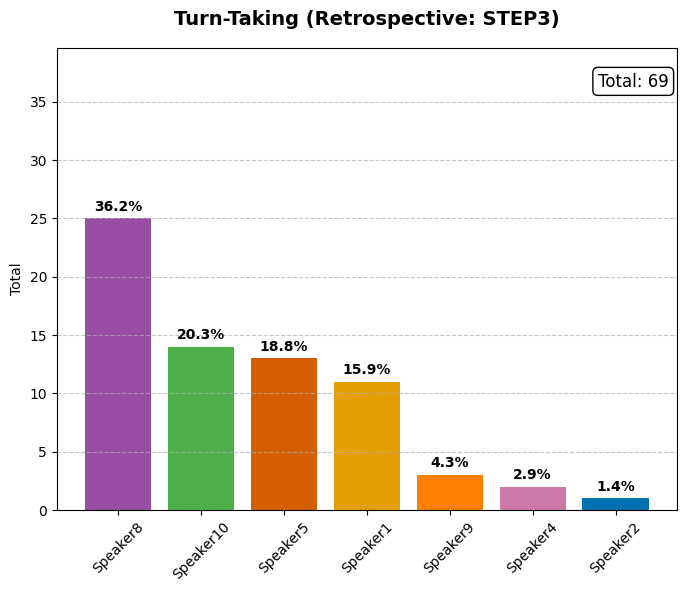
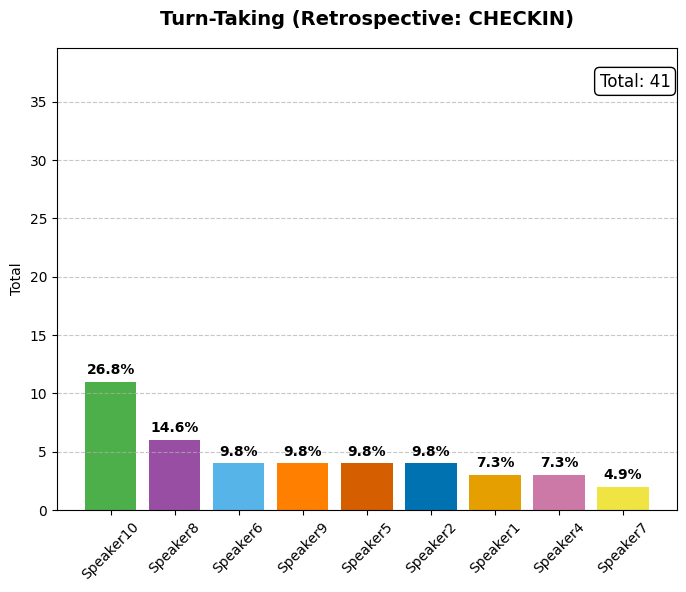
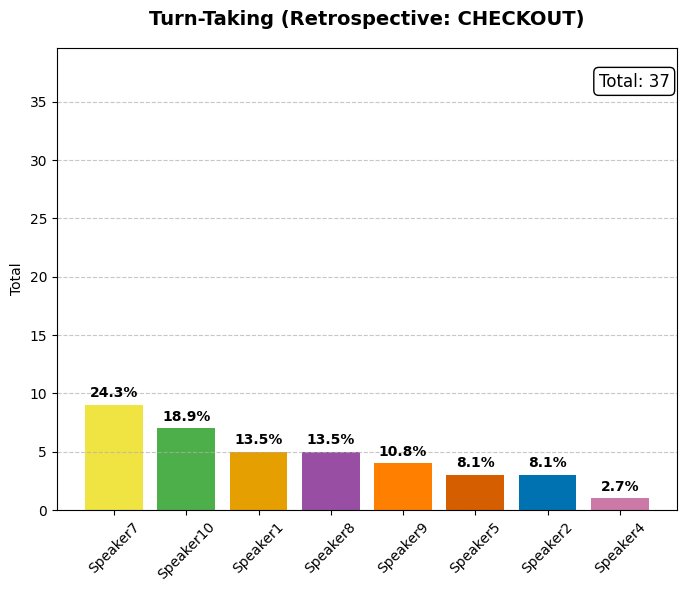
Description
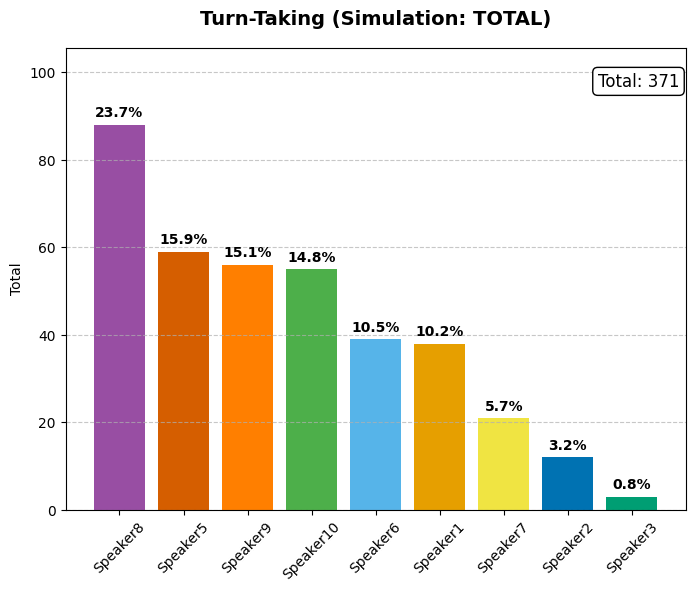
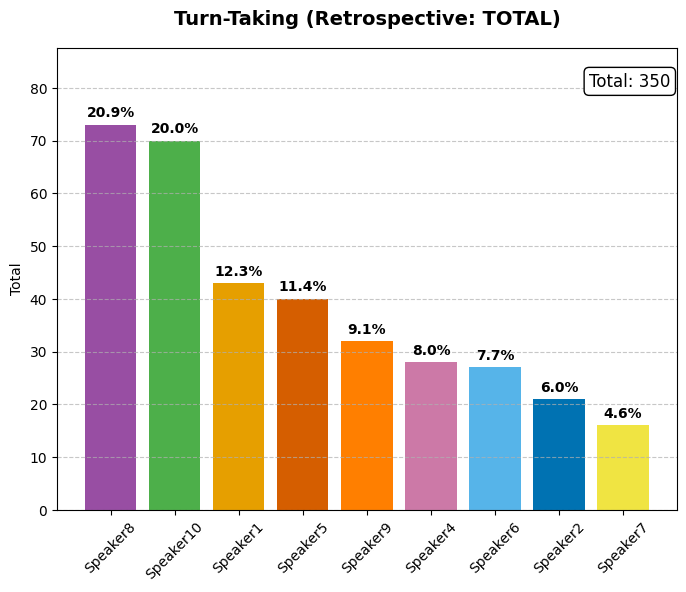
The Turn-Taking bar chart displays the number of speaking turns taken by each participant, providing insights into engagement levels and contribution dynamics throughout the discussion.
Relevance
Equitable turn-taking is a key driver of inclusivity, mutual respect, and balanced decision-making. Research highlights that teams with fair speaking opportunities ensure diverse perspectives are heard, reducing the risk of dominant voices overshadowing others. Consistently balanced turn-taking fosters team cohesion and collaboration, promoting active listening, shared ownership, and psychological safety—all essential for high team performance.
Interpreting
- Evaluate Distribution – A high number of turns typically signals engagement, while low counts may indicate hesitation, disengagement, or exclusion.
- Consider Context – Simulations may have role-driven speaking patterns, whereas retrospectives should show more balanced participation.
- Identify Trends – Consistently low turn counts may suggest a need to encourage quieter voices or improve inclusion.
Probing Questions
- Individual Level
- Did I take enough turns to contribute meaningfully, or did I hold back?
- Did I actively encourage others to participate, or did I wait for them to jump in?
- Team Level
- Were turns shared equitably, or did certain individuals dominate?
- Did interruptions or long pauses affect the natural flow of the discussion?
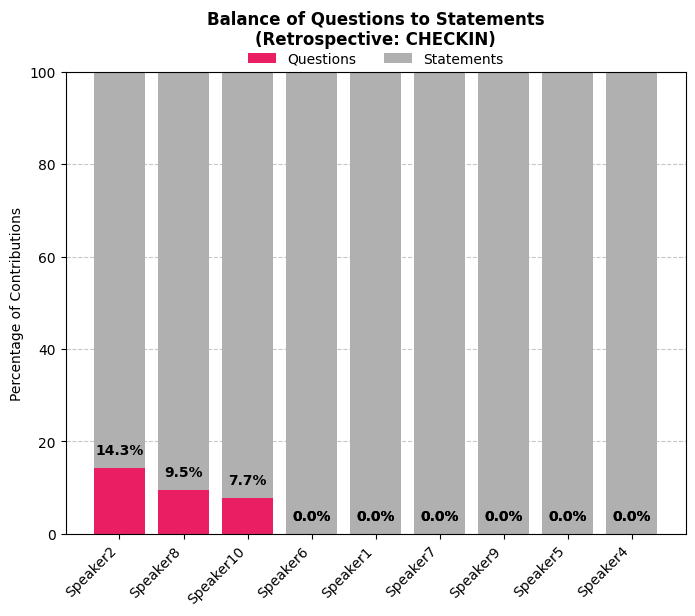
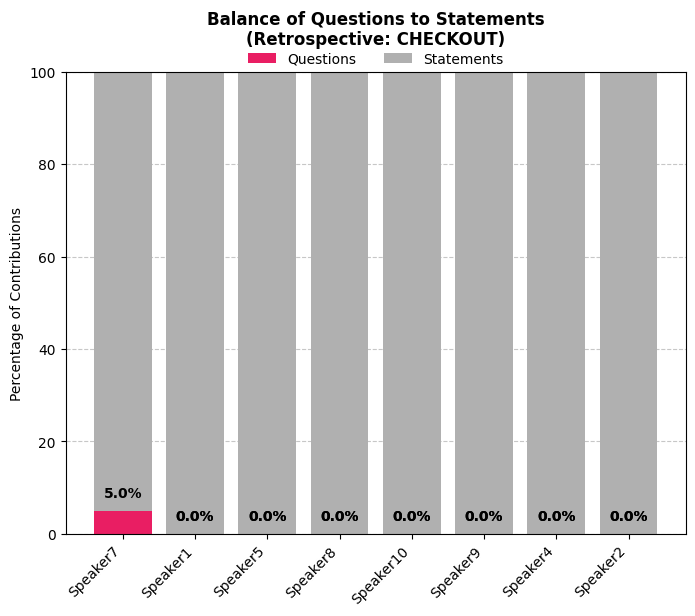
Questions vs. Statements Analysis
Expand to read the description, relevance & probing questions
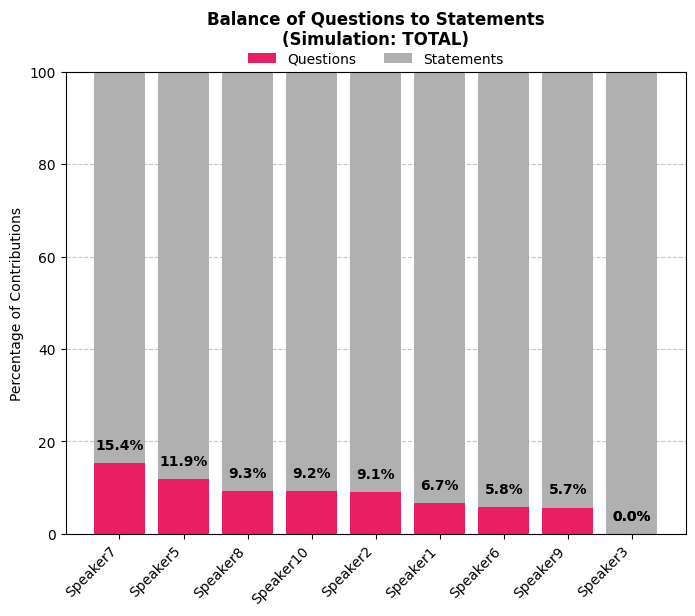
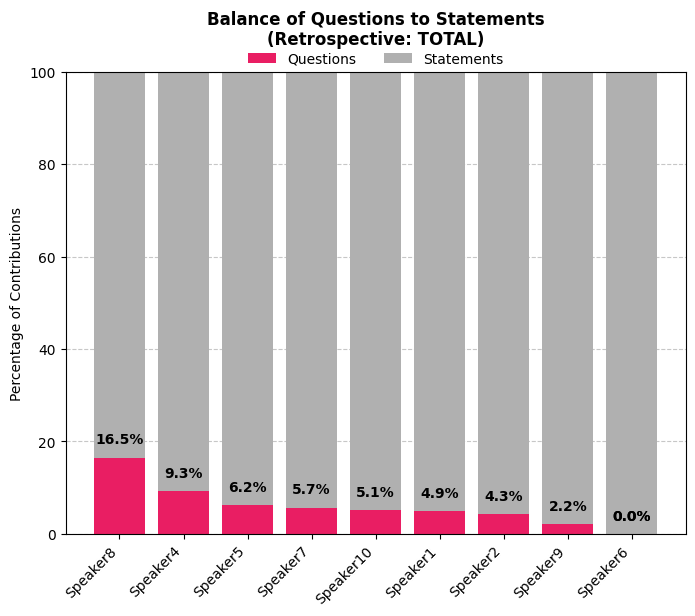
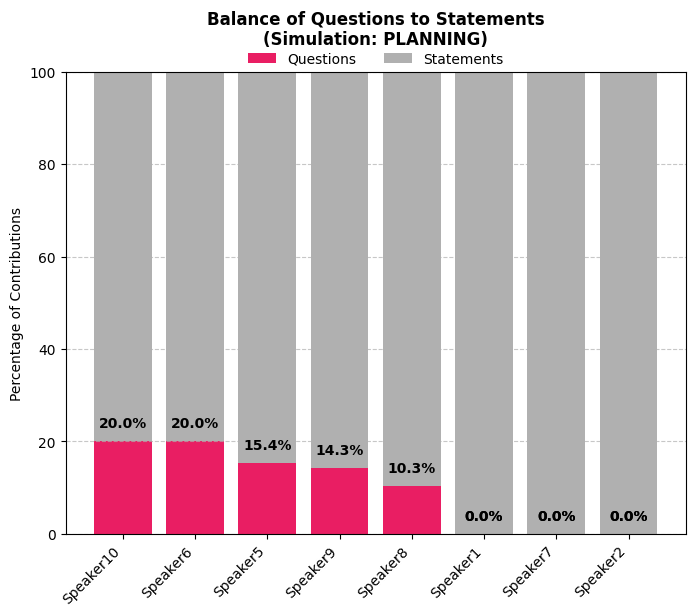
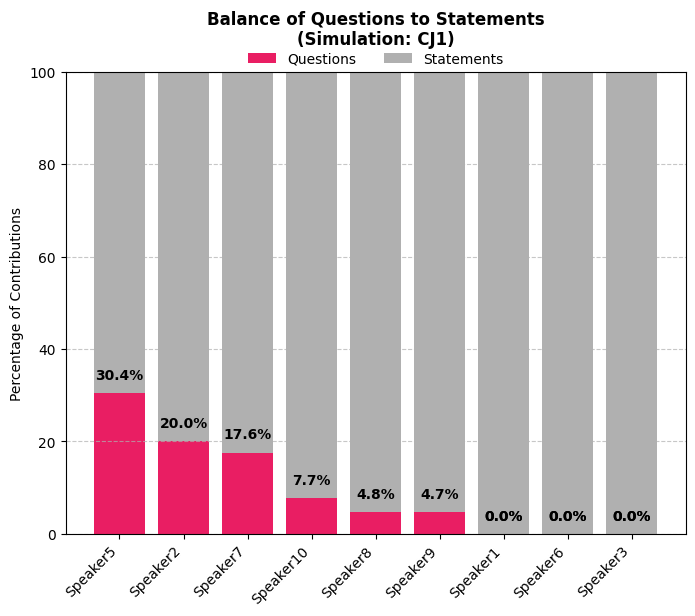
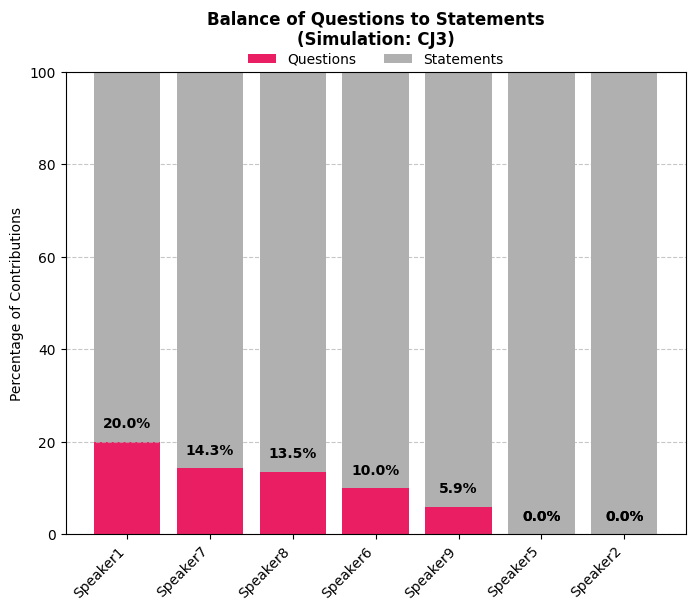
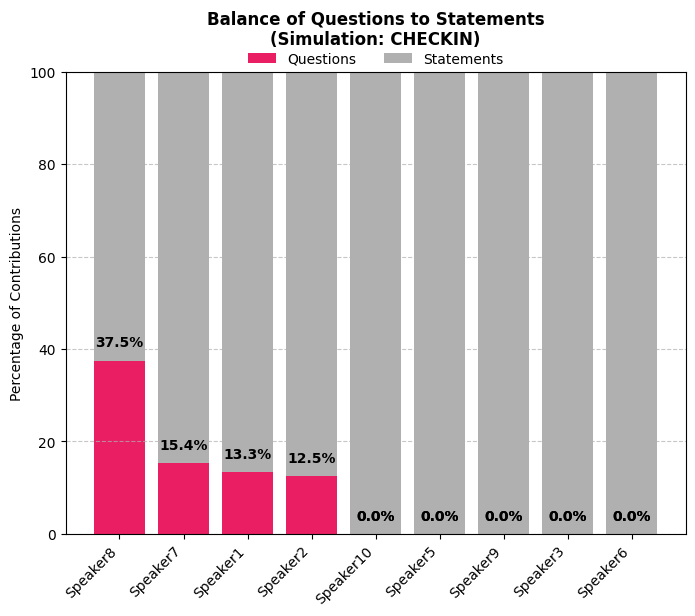
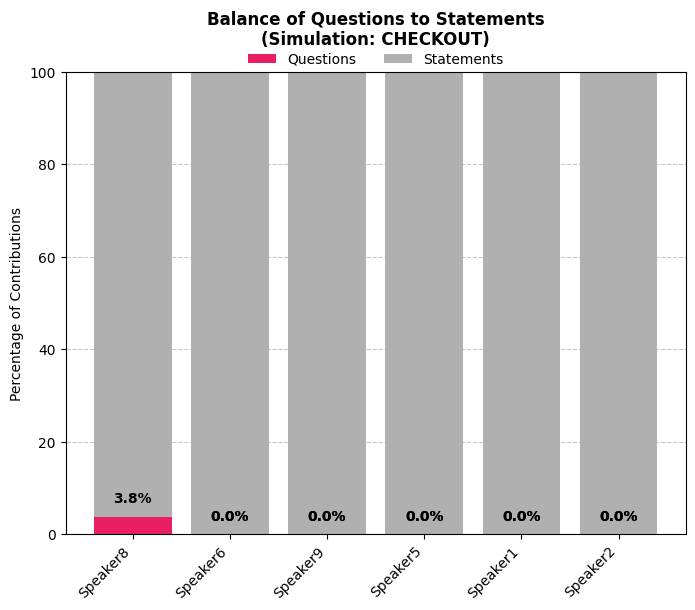
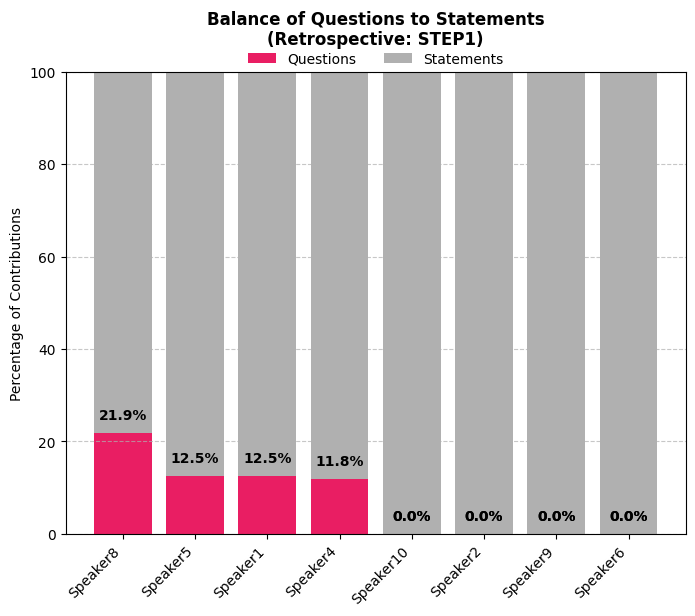
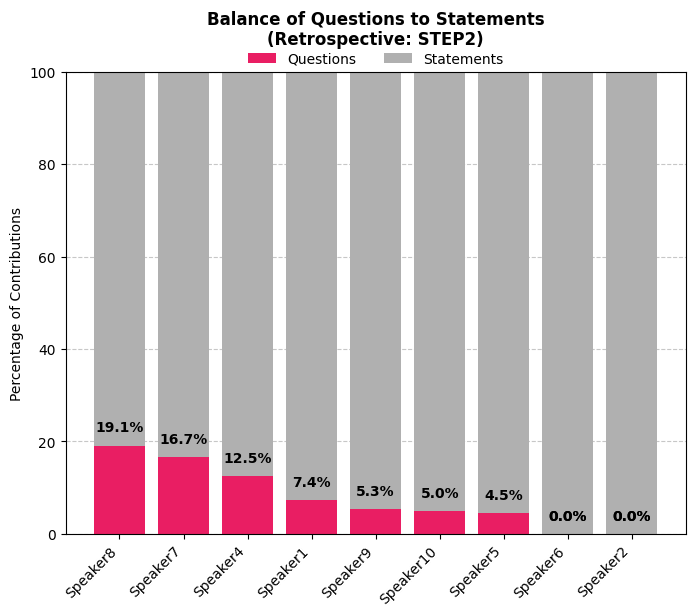
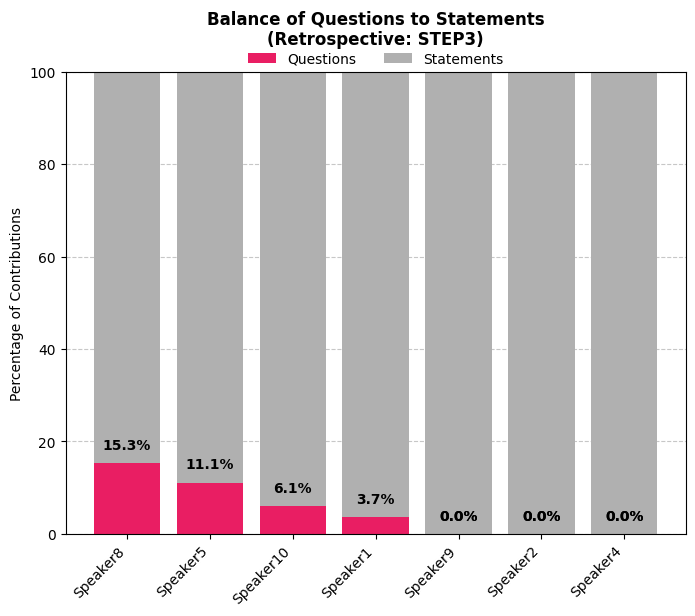
Description: This stacked bar chart illustrates the balance between questions (inquiry) and statements (assertiveness) made by each participant. It highlights how individuals navigated between seeking information and presenting ideas, offering insights into the team’s communication style and decision-making dynamics.
Relevance: Effective teamwork relies on a healthy balance between inquiry and assertiveness. Inquiry fosters psychological safety, engagement, and inclusivity by encouraging curiosity and deeper understanding. Assertiveness drives clarity, alignment, and decision-making, ensuring that discussions remain focused and actionable. Teams that lack inquiry may struggle with disengagement or dominance, while excessive inquiry can delay action and hinder decisiveness. Achieving the right balance supports collaboration, creativity, and problem-solving, particularly in complex tasks.
Interpreting:
- Assess Ratios – A high proportion of questions signals curiosity and engagement, while more statements indicate clarity and direction.
- Consider Context – In simulations, teams may lean toward assertiveness to drive decisions, whereas in retrospectives, inquiry is typically more valuable for reflection and learning.
- Spot Extremes – Too many questions may slow down decision-making, while too few may indicate dominance, disengagement, or a lack of curiosity. Aim for a balanced approach.
Probing Questions:
- Individual Level
- Did I ask more questions or make more statements? How did that impact the discussion?
- Were my questions open-ended and thought-provoking, or did they simply confirm my own perspective?
- Team Level
- Did our team balance curiosity (questions) and assertion (statements)?
- Did some individuals ask most of the questions while others primarily made statements? What impact did that have on the discussion?
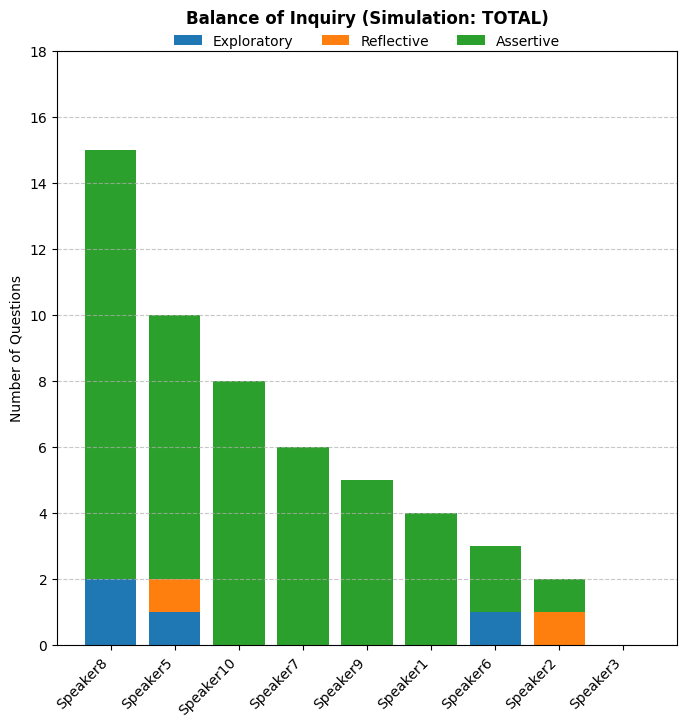
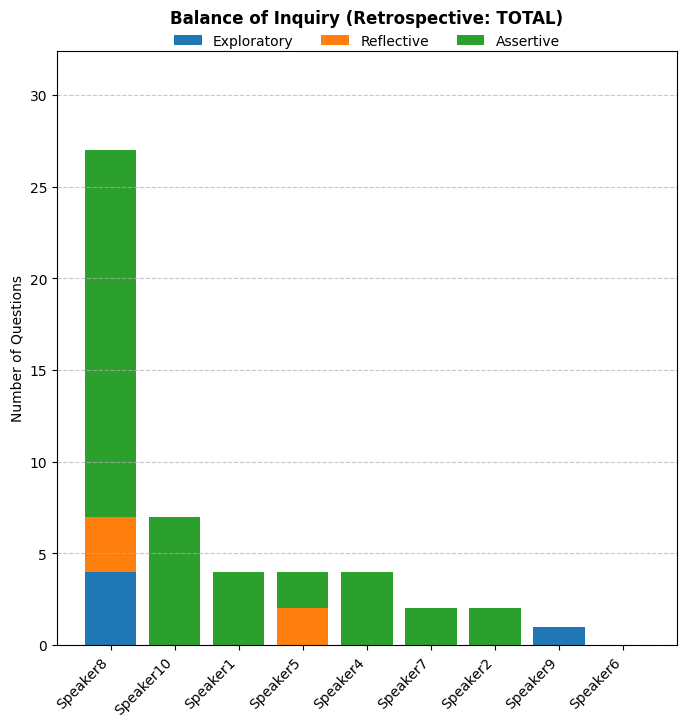
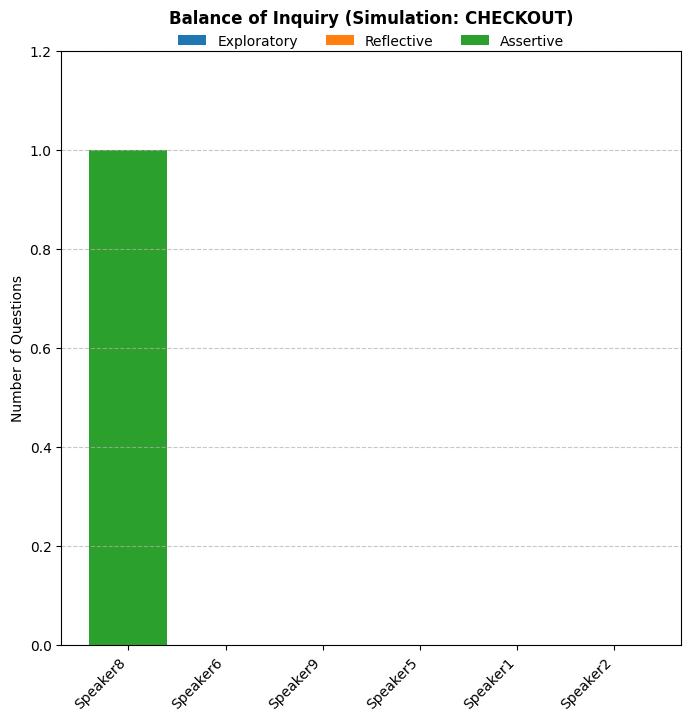
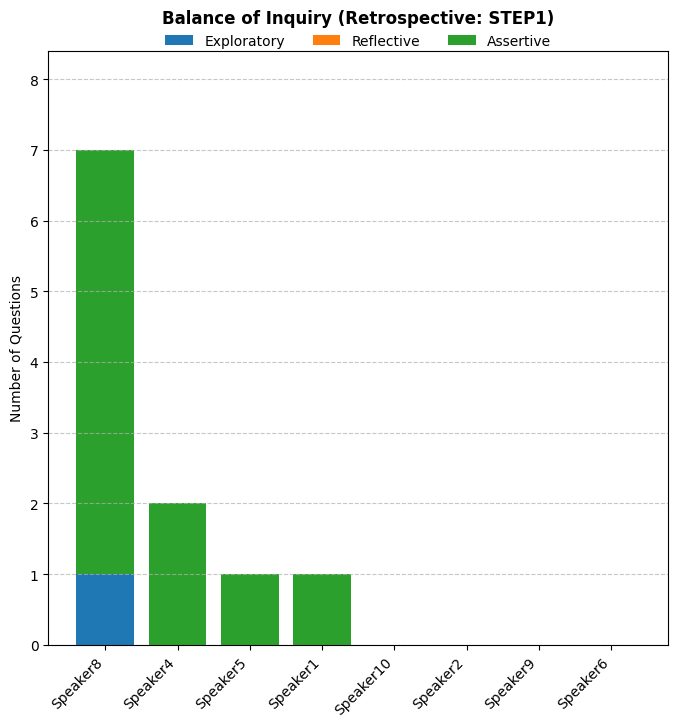
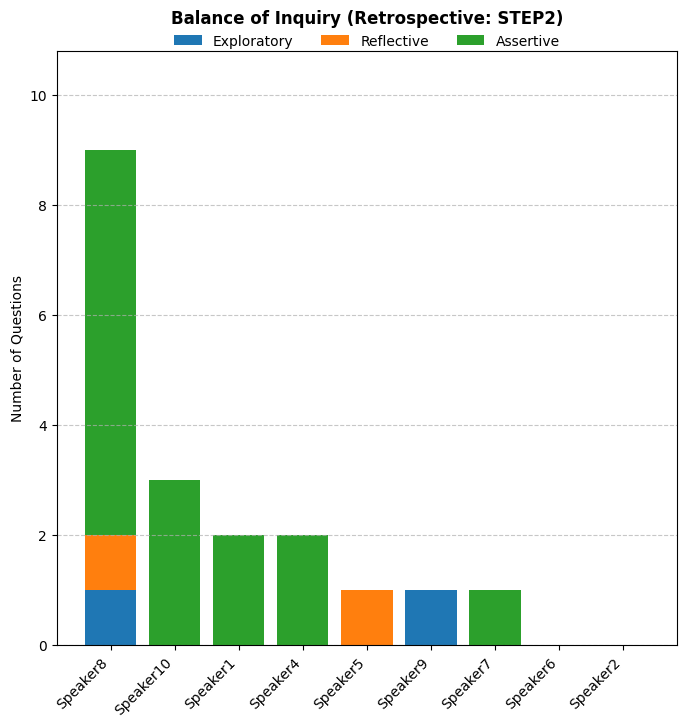
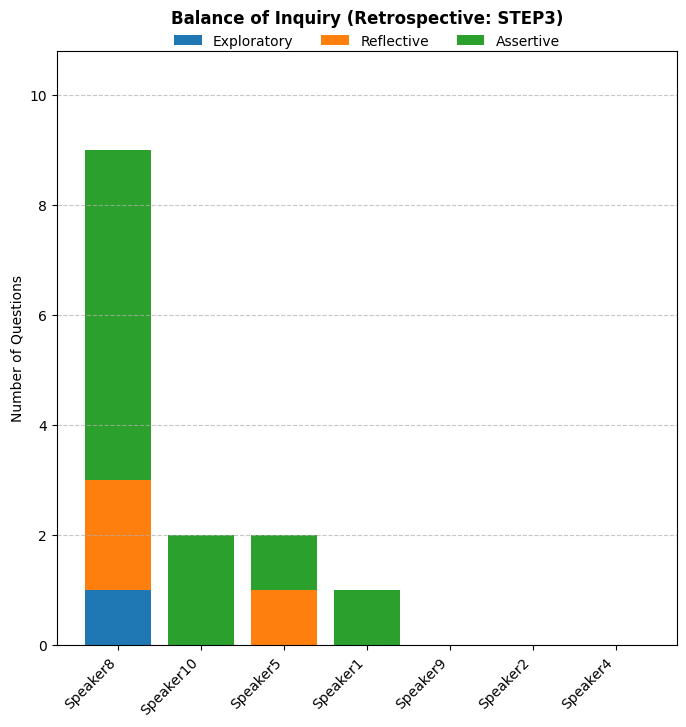
Balance of Inquiry Analysis
Expand to read the description, relevance & probing questions
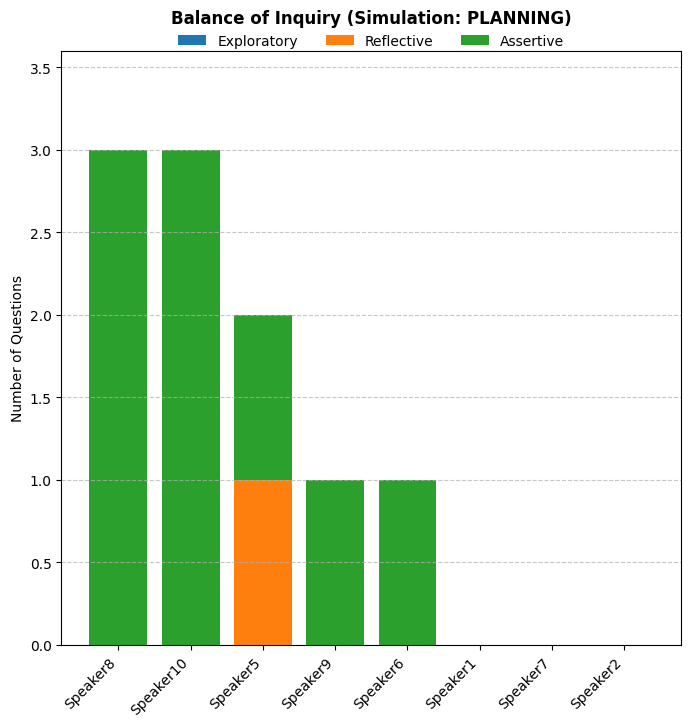
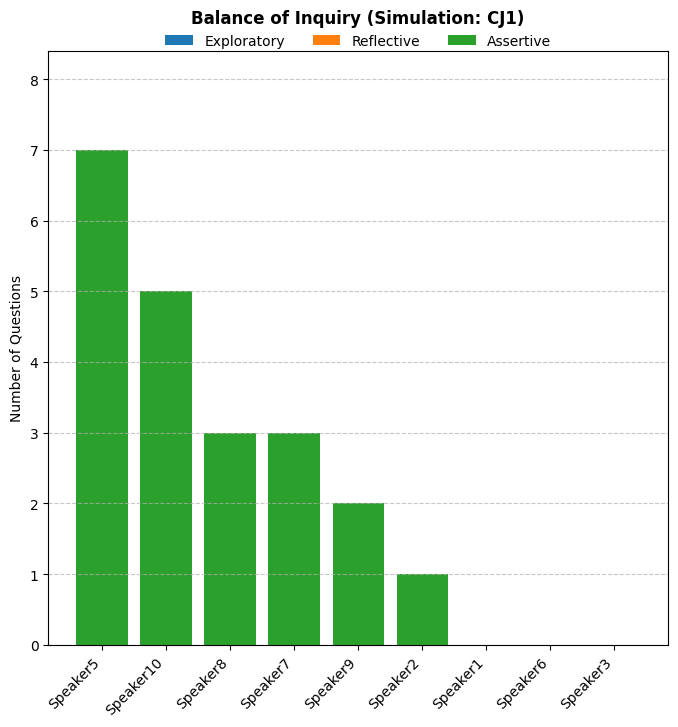
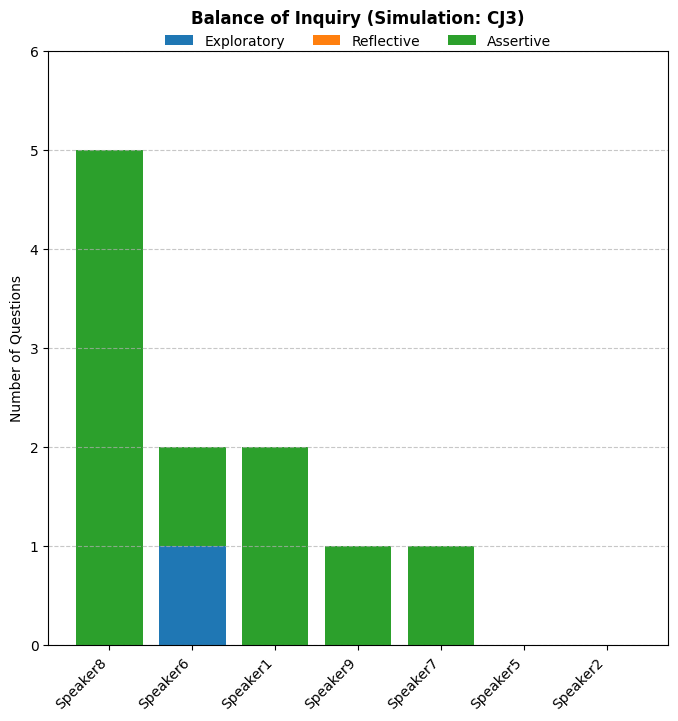
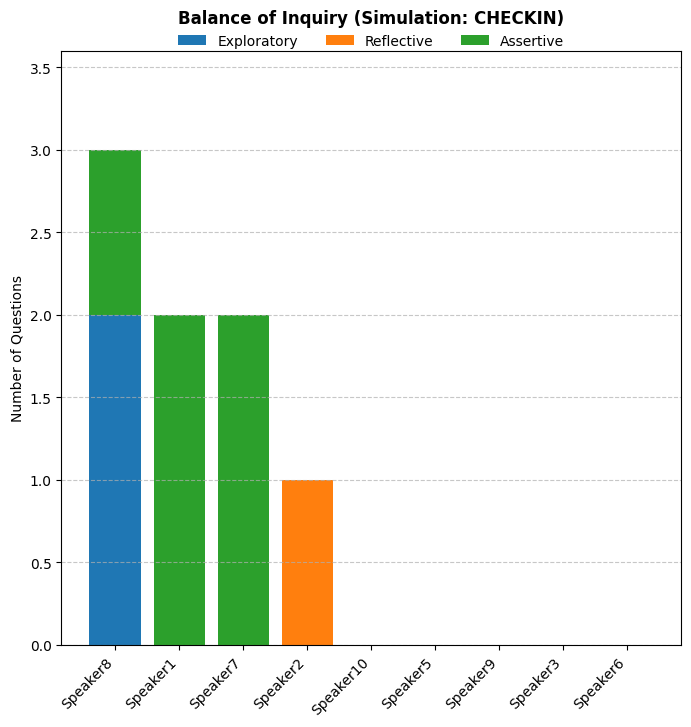
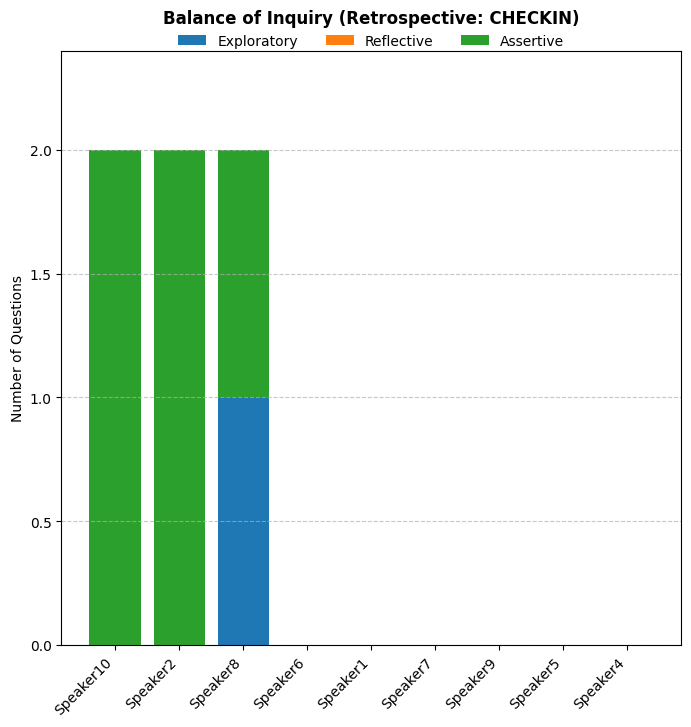
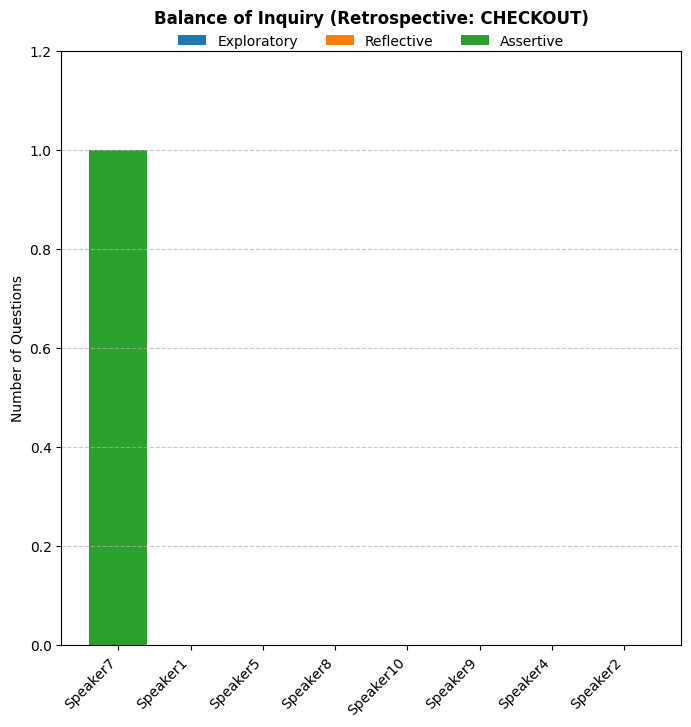
Description: This bar chart categorizes questions into three distinct types: Exploratory Questions – Encourage curiosity, broaden perspectives, and generate new ideas. Reflective Questions – Critically assess assumptions, past decisions, and team processes, helping to identify potential blind spots. Assertive Questions – Focus on clarity, alignment, and driving decisions, ensuring that discussions remain focused and actionable. This chart helps teams analyze their inquiry dynamics, revealing how well they balance curiosity, critical thinking, and decisiveness in discussions.
Relevance: Research on effective teamwork highlights the importance of balancing inquiry styles to enhance collaboration and performance. Exploratory questions foster psychological safety and creativity, driving diverse ideas. Reflective questions enhance critical thinking, mitigating blind spots in decisions and processes. Assertive questions ensure clarity and alignment, essential for progress. Mastering this balance strengthens team communication, adaptability, and problem-solving.
Interpreting:
- Evaluate Balance – A healthy mix of exploratory, reflective, and assertive questions supports creativity, critical thinking, and decisiveness.
- Identify Gaps – Over-reliance on one type of question may hinder alignment, slow decision-making, or limit creativity.
- Consider Context – Simulations often require more assertive questions for decision-making, while retrospectives should emphasize exploration and reflection to drive learning.
Probing Questions:
- Individual Level
- What type of questions did I ask the most—exploratory, reflective, or assertive?
- Did I adapt my questioning style based on the situation, or was it one-dimensional?
- Team Level
- Did our team use a mix of exploratory, reflective, and assertive questions?
- Were there too few assertive questions, making decision-making slow, or too few exploratory ones, limiting creativity?
Contributions Over Time Analysis
Expand to read the description, relevance & probing questions
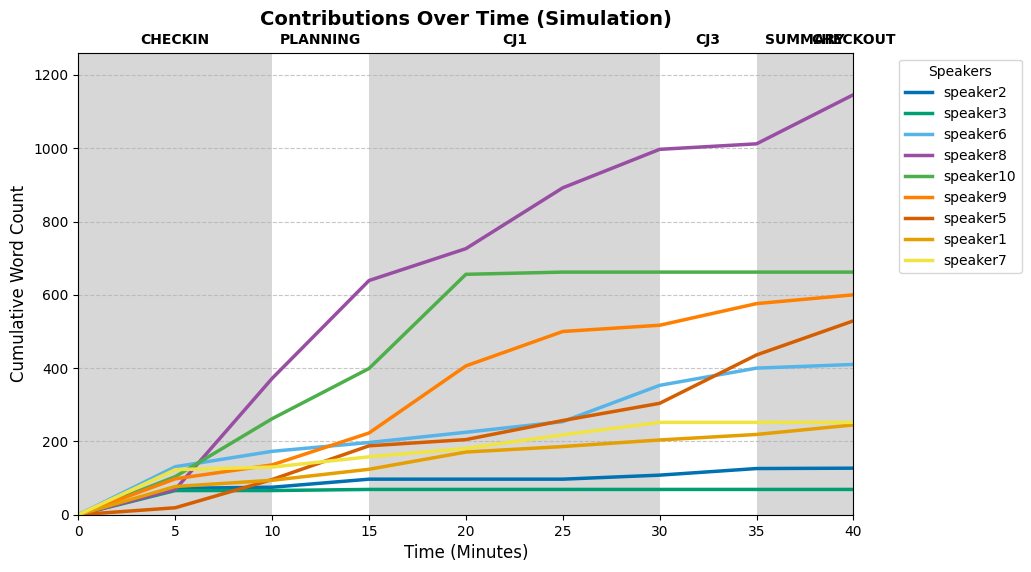
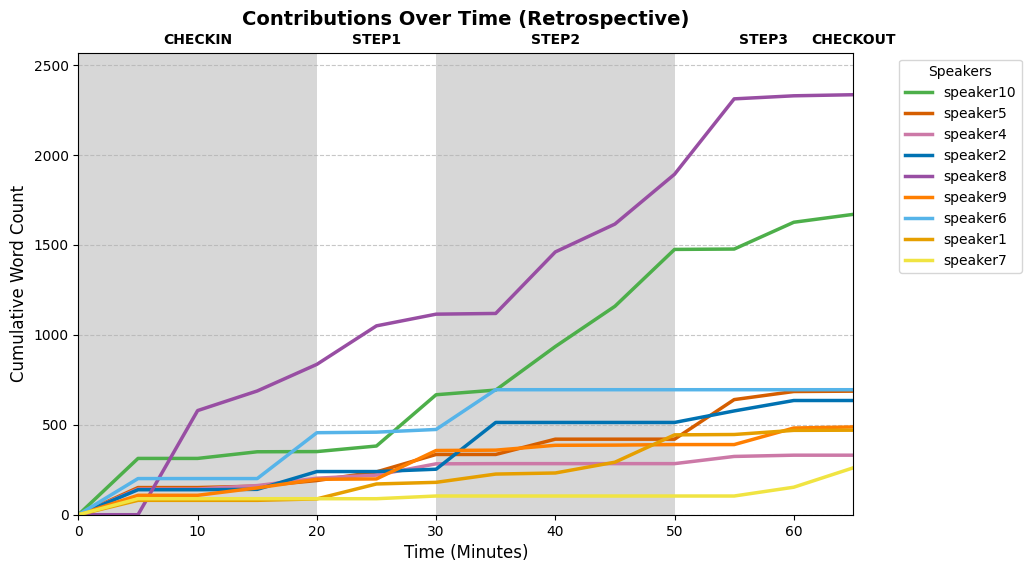
Description: The Contributions Over Time line graph tracks the cumulative word count of each participant, illustrating how engagement and communication dynamics evolved throughout the discussion. This visualization helps identify patterns in participation levels, dominance, and engagement shifts over time.
Relevance: Research on group performance underscores the importance of sustained and balanced contributions for tackling complex tasks. Equitable participation over time fosters collaboration, inclusivity, and resilience against dominance. Monitoring contribution trends can help identify engagement gaps and implement corrective actions to optimize discussion flow. Such balance ensures that no single voice dominates and that all team members contribute meaningfully to problem-solving and decision-making.
Interpreting:
- Identify Trends – Steady growth in contributions indicates consistent engagement, while flat lines may signal disengagement.
- Look for Dominance – Sharp spikes suggest that one or more voices may have overpowered the discussion, limiting balanced input.
- Consider Context – Role demands may influence input distribution in simulations, while retrospectives should reflect more even participation.
- Spot Key Moments – Sudden shifts may highlight pivotal discussion points, shifts in engagement, or changes in group dynamics.
Probing Questions:
- Individual Level
- Was my engagement steady, or did I speak more or less at certain moments? Why?
- Did I disengage at any point? What factors contributed to that?
- Team Level
- Were contributions steady across the team, or did certain individuals dominate at key points?
- How can we create an environment where participation remains consistent throughout?
Turn‑Taking Over Time Analysis
Expand to read the description, relevance & probing questions
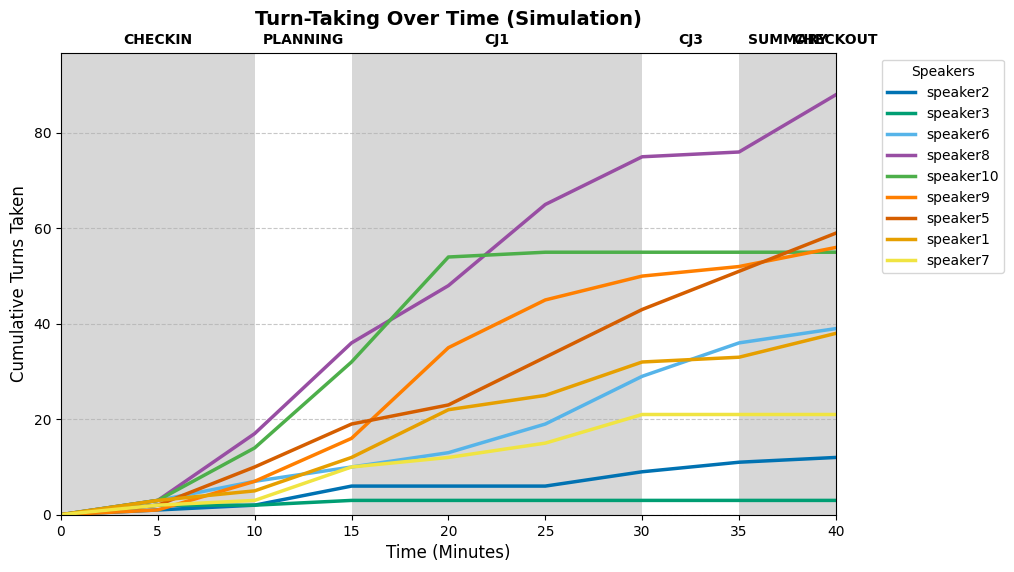
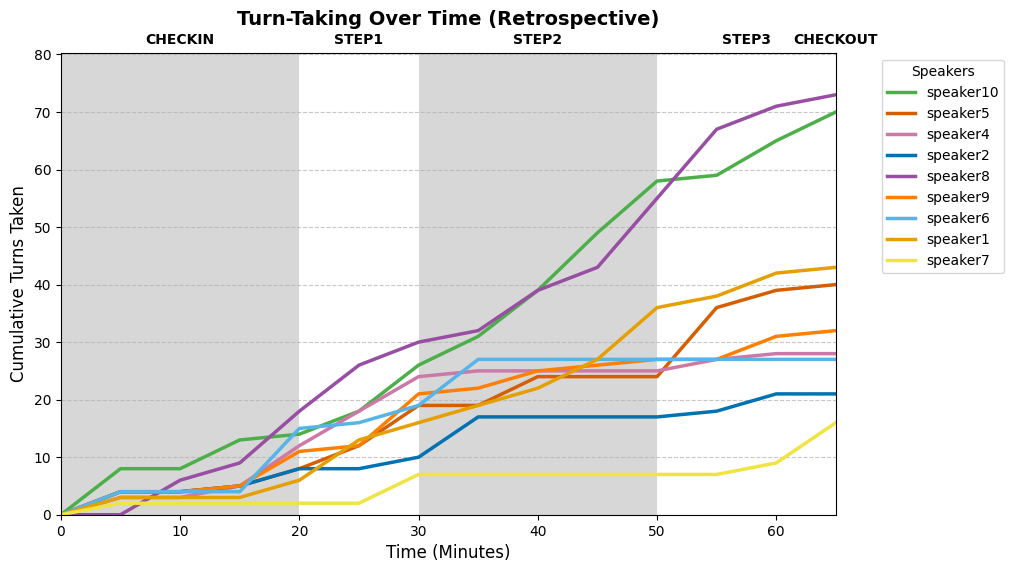
Description: The Turn‑Taking Over Time line graph tracks the cumulative number of speaking turns taken by each participant throughout the discussion. This metric provides insight into how engagement evolves over time and whether opportunities to contribute are equitably distributed.
Relevance: Research emphasizes that balanced turn‑taking supports inclusivity, mutual respect, and collaboration by ensuring all voices are heard. Monitoring turn‑taking trends helps identify participants who dominate or disengage as discussions progress. This perspective reveals whether the dialogue flow fosters psychological safety and engagement or reflects imbalances that may hinder team performance.
Interpreting:
- Assess Consistency – A steady increase in speaking turns suggests consistent engagement, while flat lines may indicate disengagement or missed opportunities to contribute.
- Identify Dominance – Sharp rises in one participant’s turn count may signal over‑dominance, potentially limiting inclusivity.
- Consider Context – In simulations, certain roles may require more frequent contributions, whereas in retrospectives, turn‑taking should be more balanced.
- Spot Key Moments – Sudden shifts in turn‑taking may indicate critical decisions, increased engagement, or changes in group dynamics.
Probing Questions:
- Individual Level
- Was my speaking pattern consistent, or did I only engage at certain moments?
- Did I encourage others by inviting participation, or was I reactive in my engagement?
- Team Level
- Were speaking turns evenly distributed over time, or did they become clustered around a few voices?
- Did participation increase or decrease at certain points, and what might have caused that?
Turn Duration Analysis
Expand to read the description, relevance & probing questions
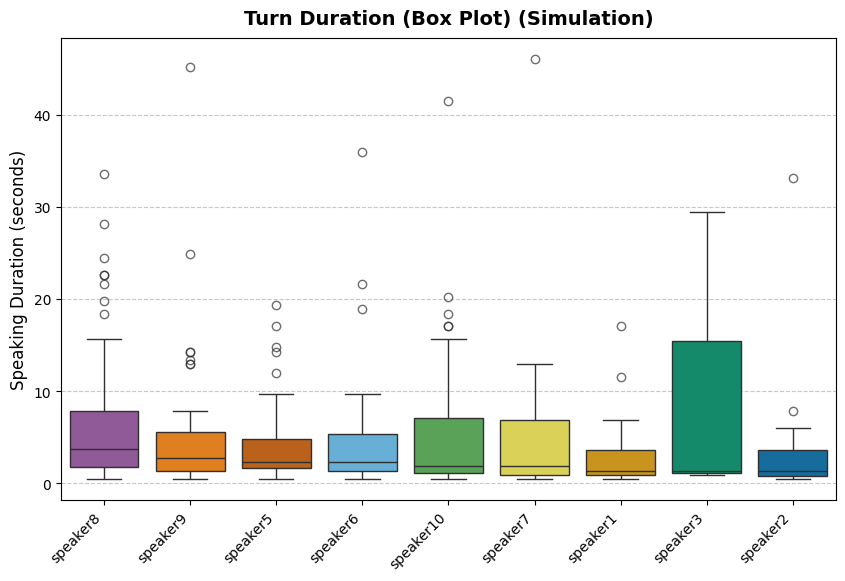
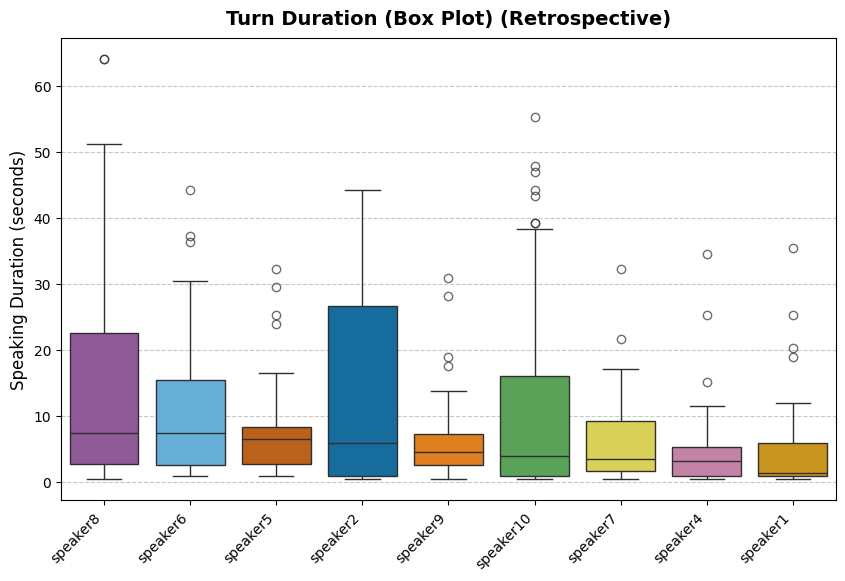
Description: The Turn Duration box plot visualizes the range and median speaking times for each participant, providing insights into the variability and balance of contributions during the discussion.
Relevance: Balanced speaking durations contribute to inclusivity and effective communication. Research highlights that disparities in turn durations may reflect dominance or hesitation, both of which can undermine team cohesion. Ensuring consistent speaking times fosters a collaborative environment where diverse ideas are equally valued. Studies suggest that balanced speaking patterns lead to greater psychological safety and shared accountability within teams.
Interpreting:
- Evaluate Medians – Long speaking durations may signal dominance, while shorter ones may indicate hesitation or lack of engagement.
- Examine Variability – Wide-ranging durations suggest inconsistent participation or uncertainty, while narrow ranges reflect more balanced engagement.
- Consider Outliers – Extremely long or short speaking turns may highlight emphasis, hesitation, or disruptions in the conversation.
- Compare Participants – Consistent durations suggest equitable participation, whereas major disparities may indicate areas for improvement.
- Contextualize – In simulations, longer speaking turns may be justified by role-specific demands, while in retrospectives, more balanced participation is generally expected.
Probing Questions:
- Individual Level
- Were my speaking turns significantly longer or shorter than others’?
- Did I balance speaking and listening, or did I dominate some exchanges?
- Team Level
- Did longer turns reflect valuable insights or someone monopolizing the conversation?
- Did shorter turns indicate hesitation, disengagement, or an efficient communication style?
Conversation Patterns Analysis
Expand to read the description, relevance & probing questions
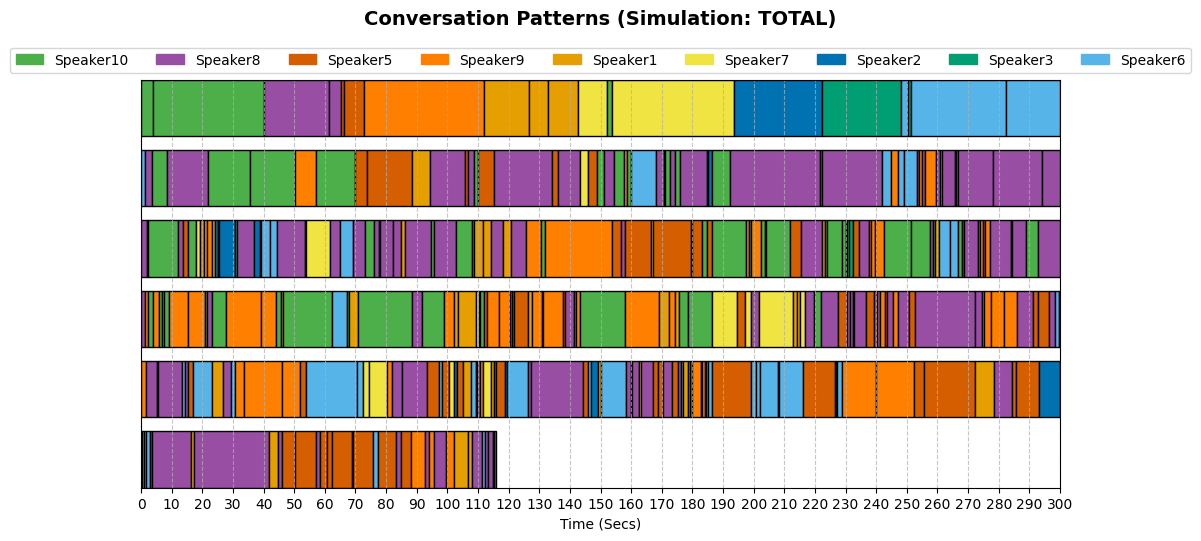
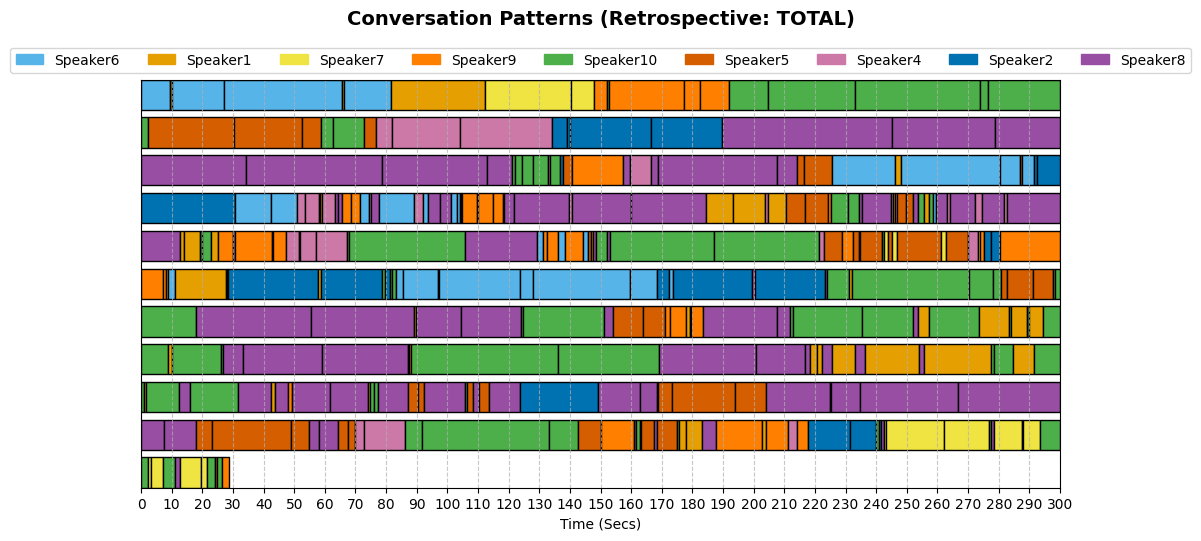
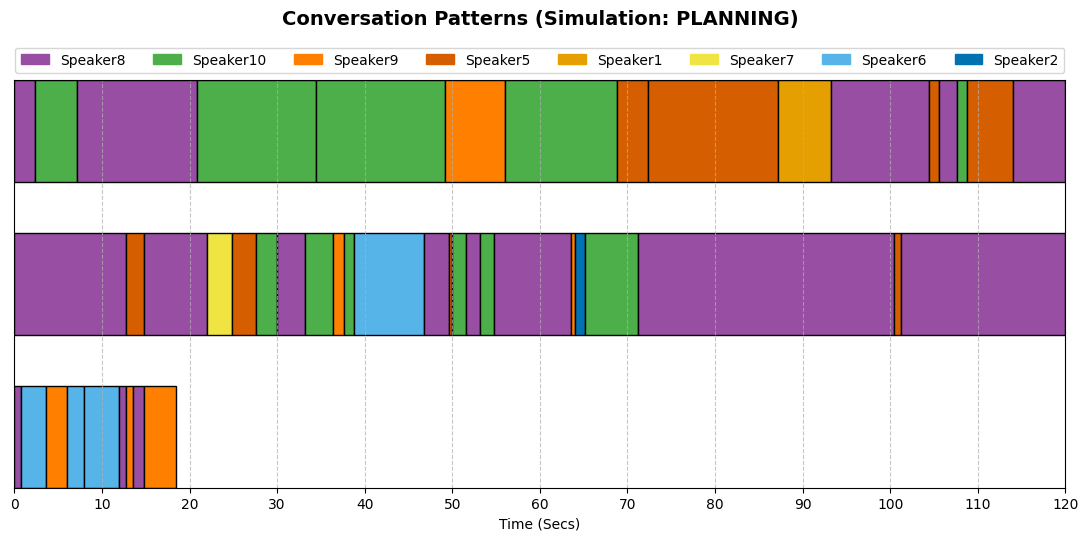
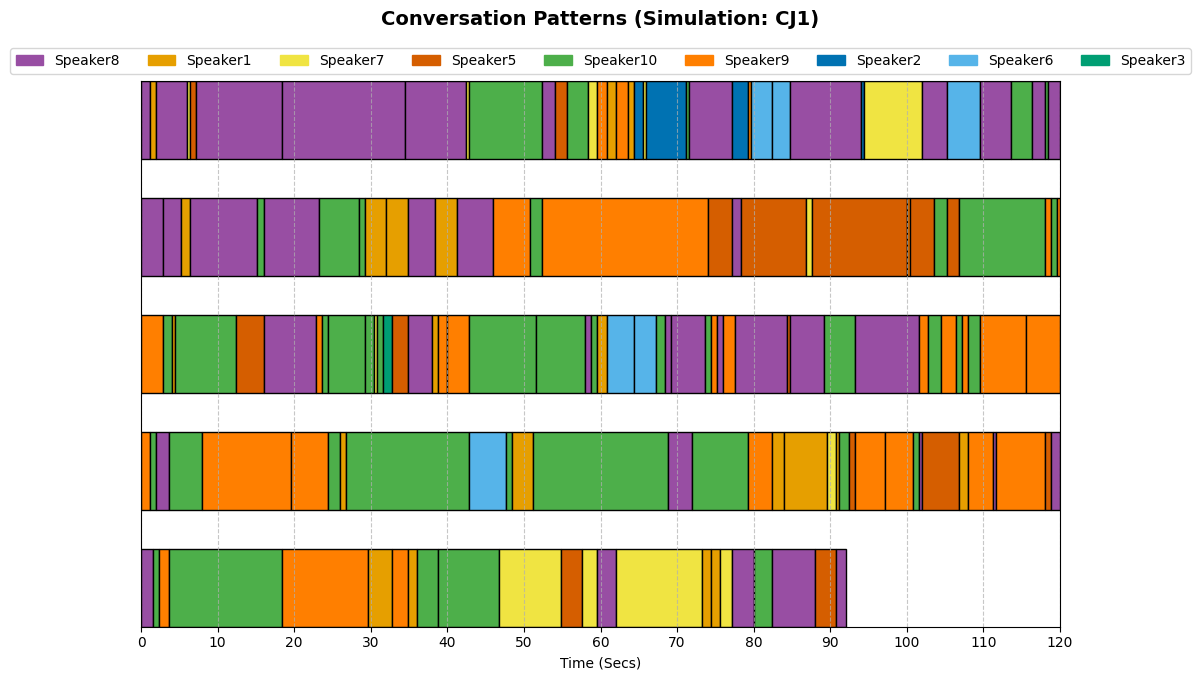
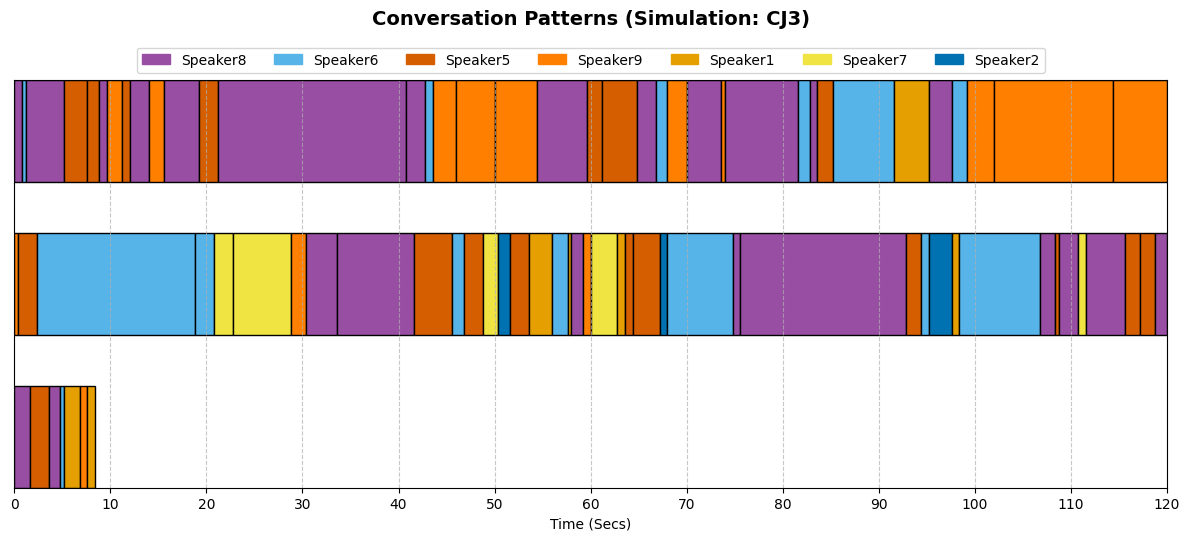
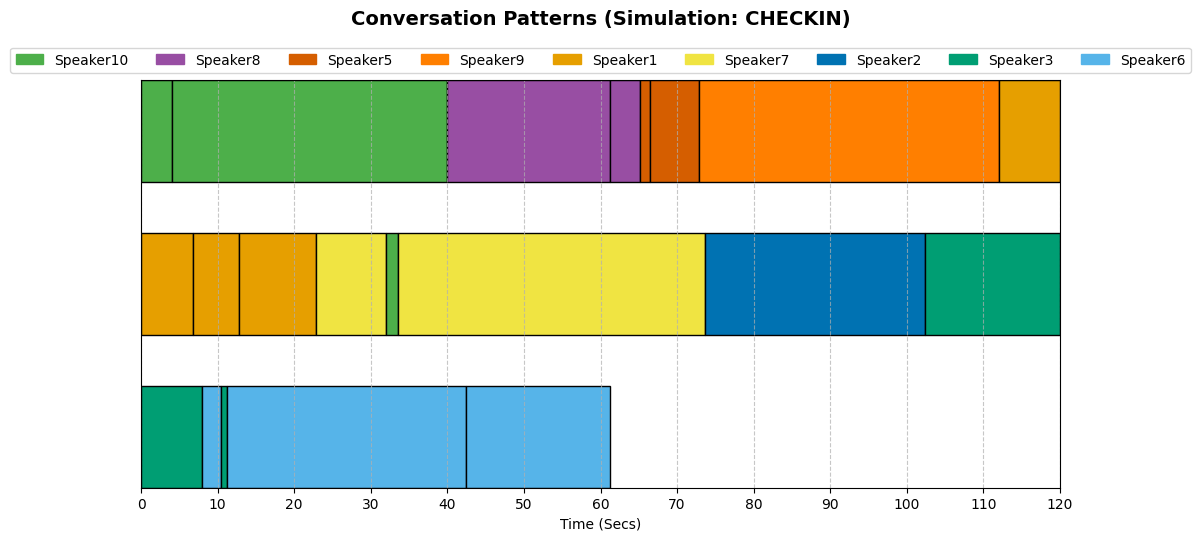
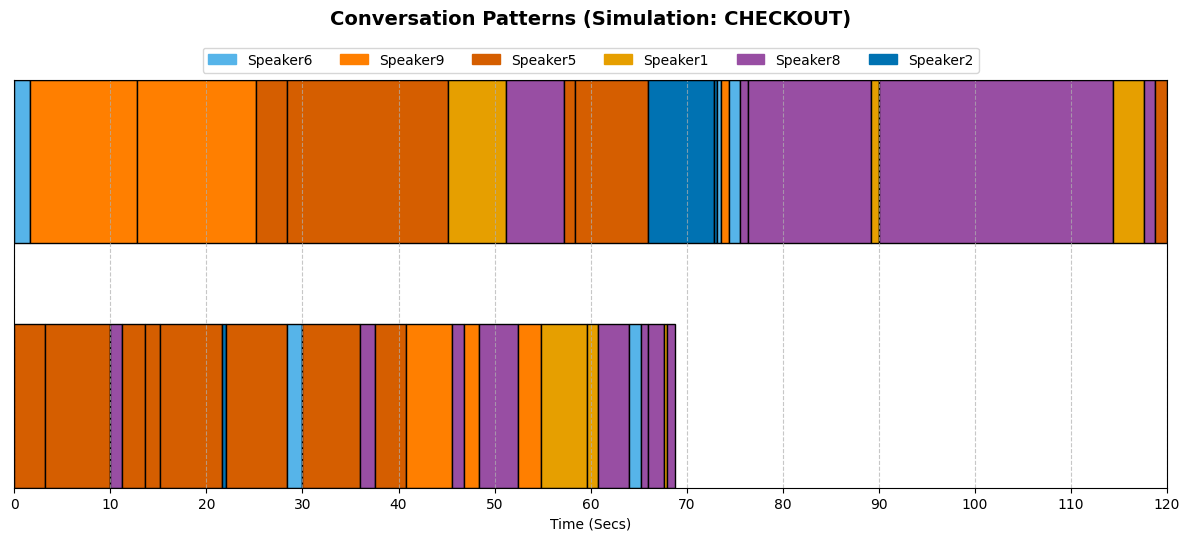
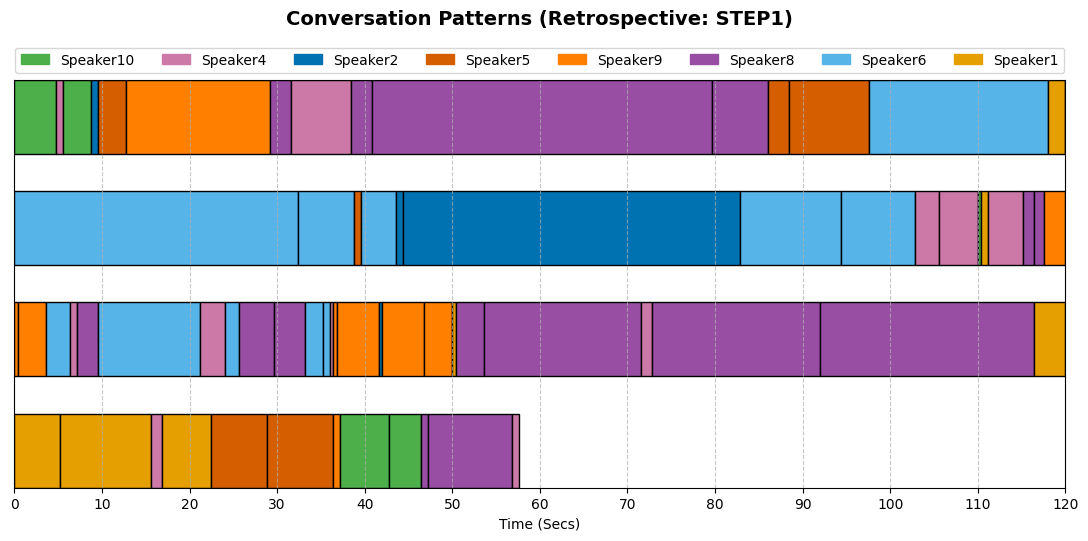
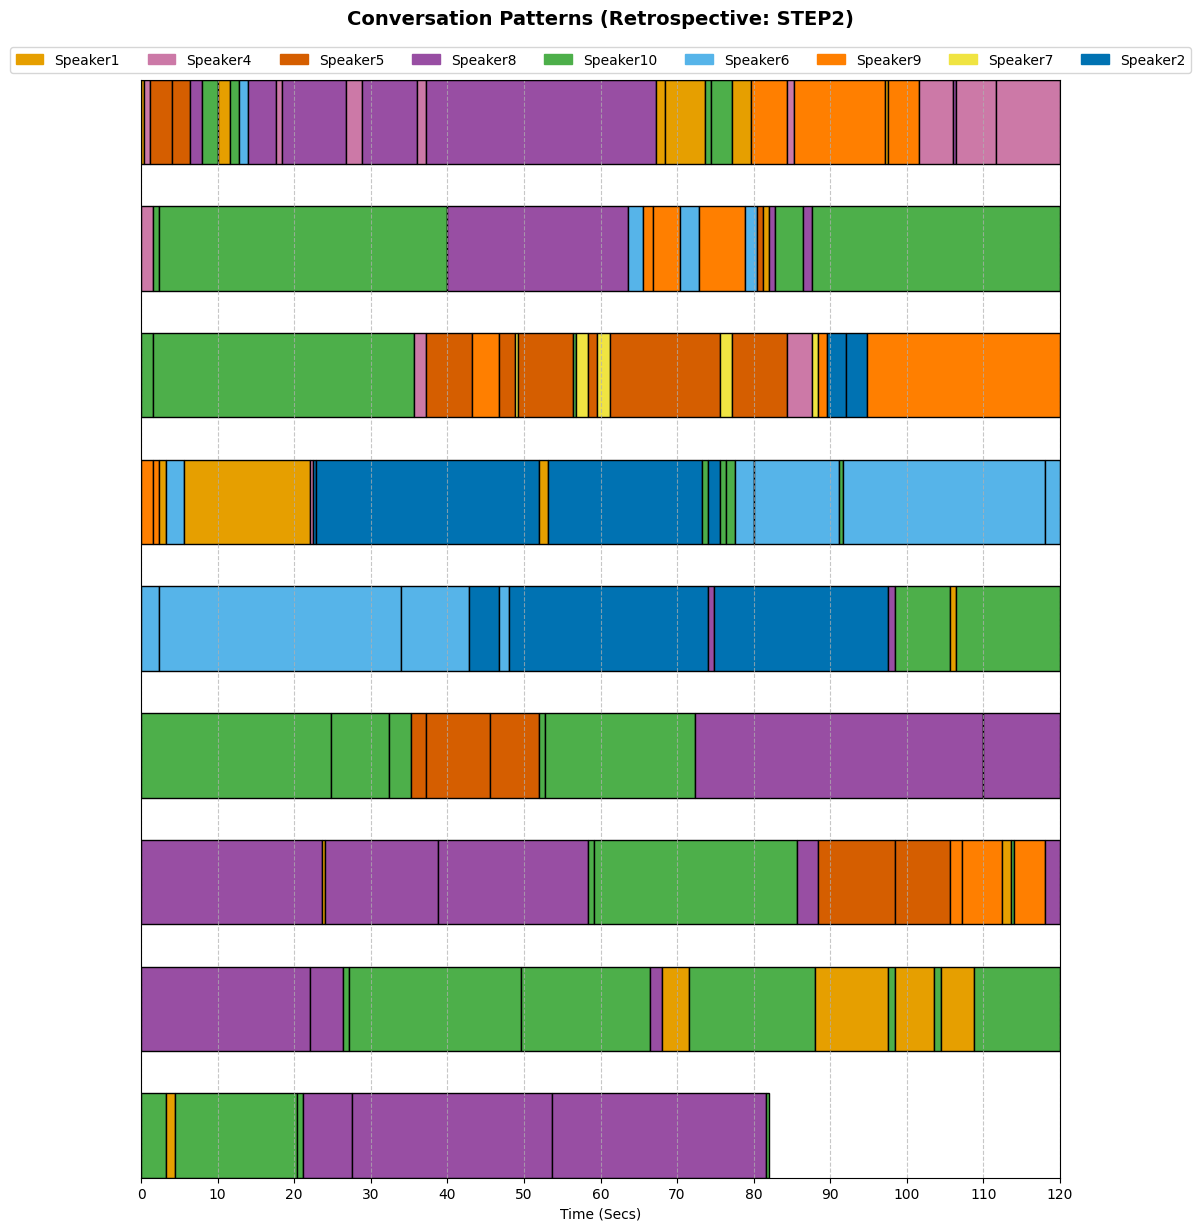
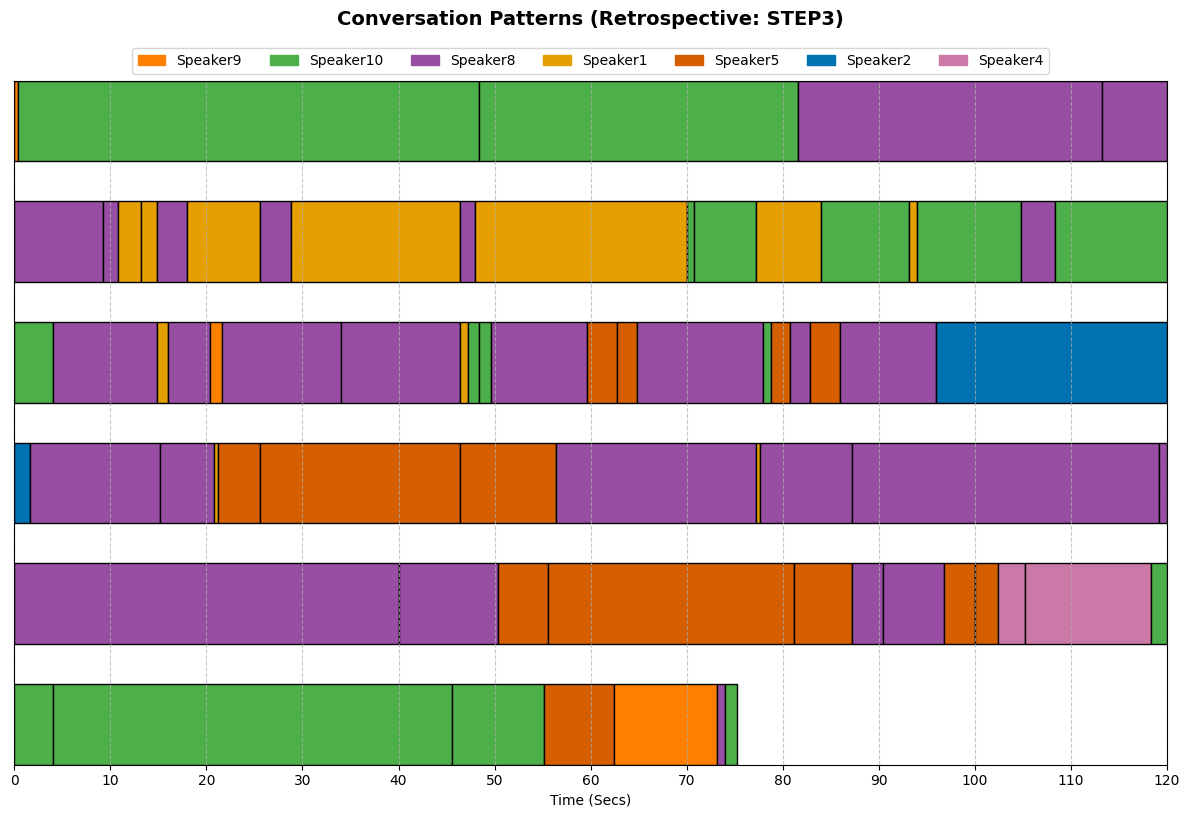
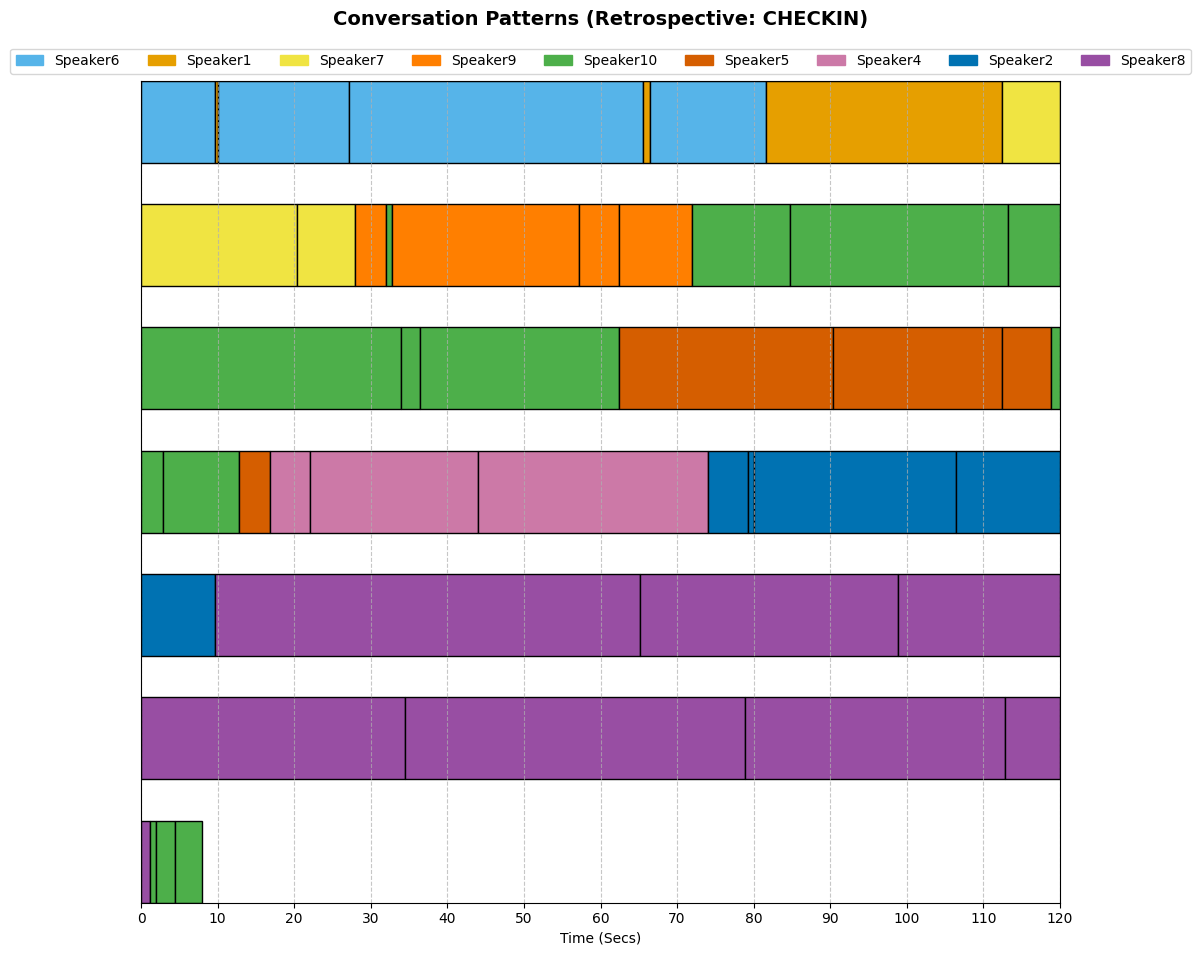
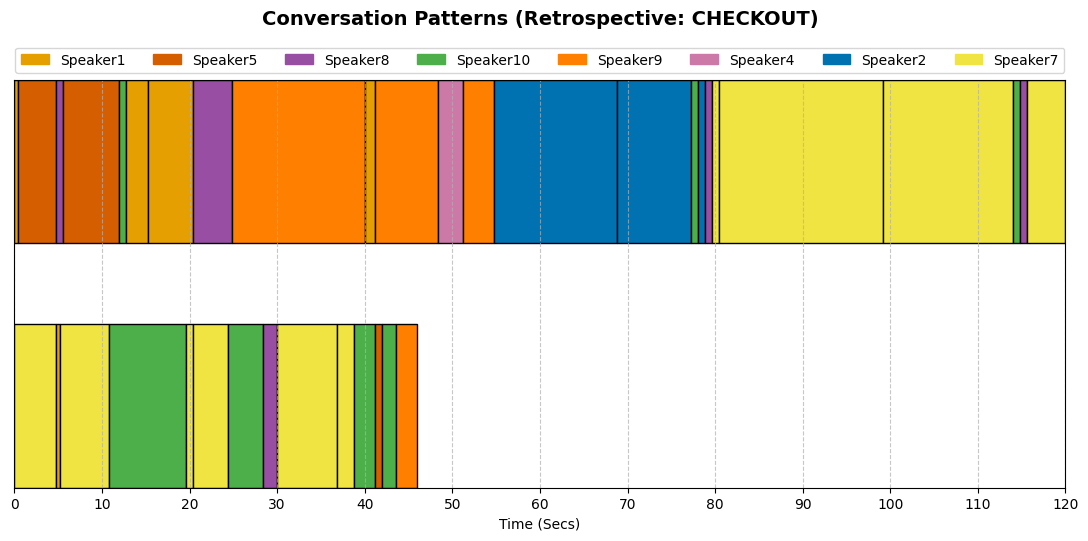
Description: The Conversation Patterns visualization represents the flow of dialogue over time, with each speaking turn displayed as a horizontal bar. The overall graph segments discussion into 5-minute intervals, while section graphs (e.g., Step 1, Step 2) use 2-minute segments. Bar length indicates turn duration, revealing the rhythm, pacing, and balance of participation.
Relevance: Research underscores that the timing and rhythm of conversation significantly shape team dynamics. High-performing teams tend to share speaking turns more evenly over time and minimize long monologues or silences. Consistent conversation patterns support engagement, trust, and joint problem-solving, while erratic patterns or prolonged dominance may signal exclusion or disengagement.
Interpreting:
- Examine Flow – Regular alternation suggests balanced participation, while long turns or gaps may indicate dominance or disengagement.
- Note Durations – Long turns can reflect detailed input or monopolization, while short turns may signal conciseness or hesitation.
- Identify Variations – Comparing sections reveals shifts in engagement, leadership, or communication style.
- Cross-Reference – Align with Turn‑Taking Over Time or Turn Duration to gain a deeper understanding of team interaction.
Probing Questions:
- Individual Level
- Did my contributions help maintain a smooth and natural flow of conversation, or did I unintentionally disrupt the rhythm?
- Were my speaking turns appropriately timed and paced, or did I dominate or hold back at key moments?
- Team Level
- Did the conversation flow feel balanced and inclusive, or fragmented and uneven?
- Were there moments when conversation stalled or became too one-sided?
Network Analysis
Expand to read the description, relevance & probing questions
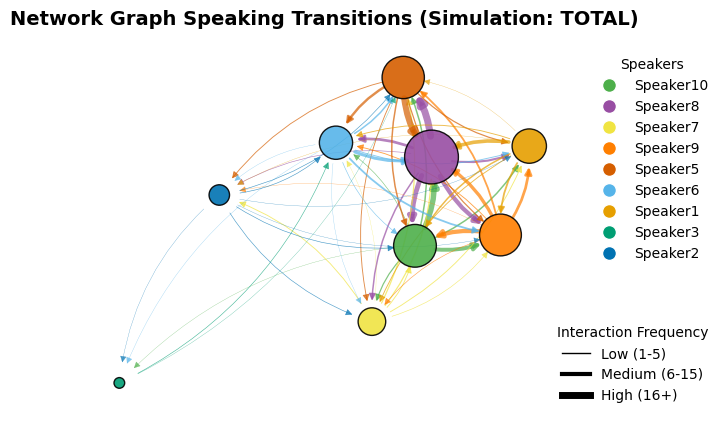
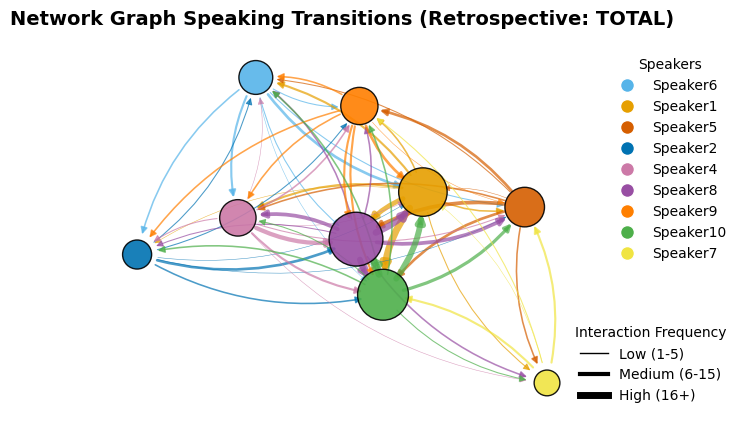
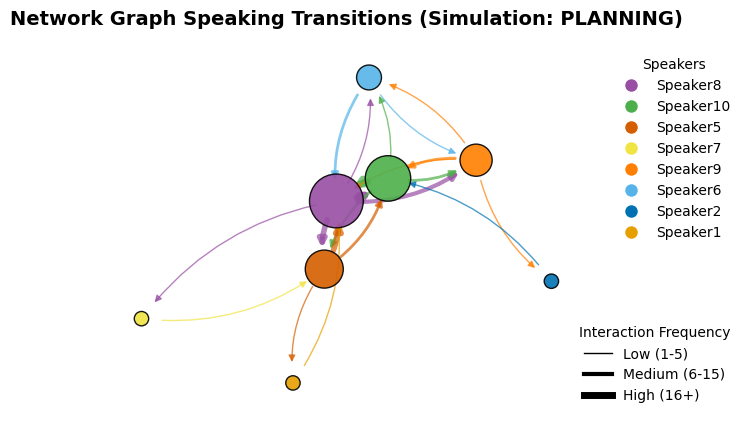
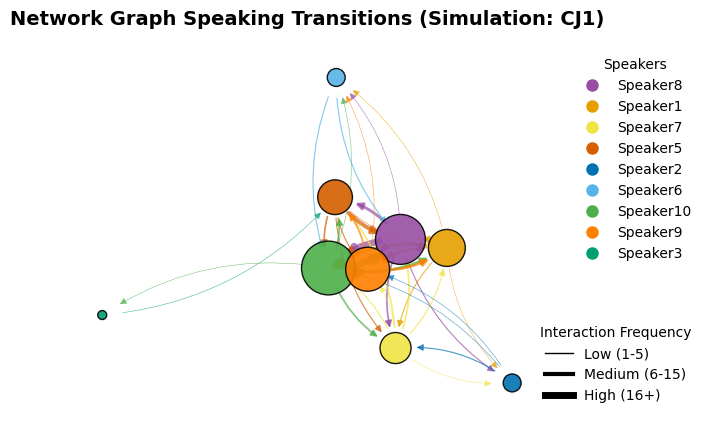
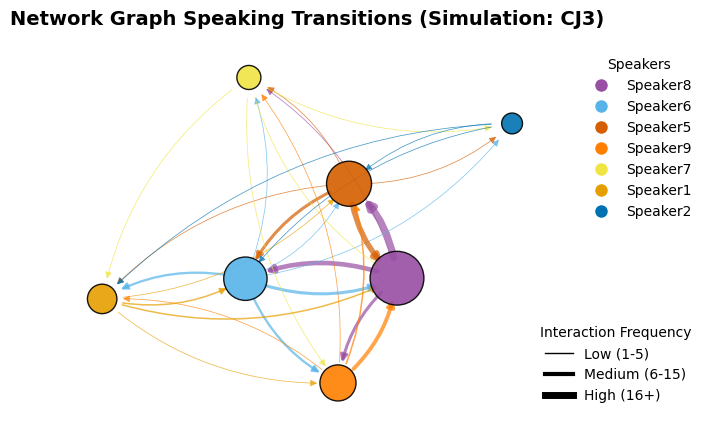
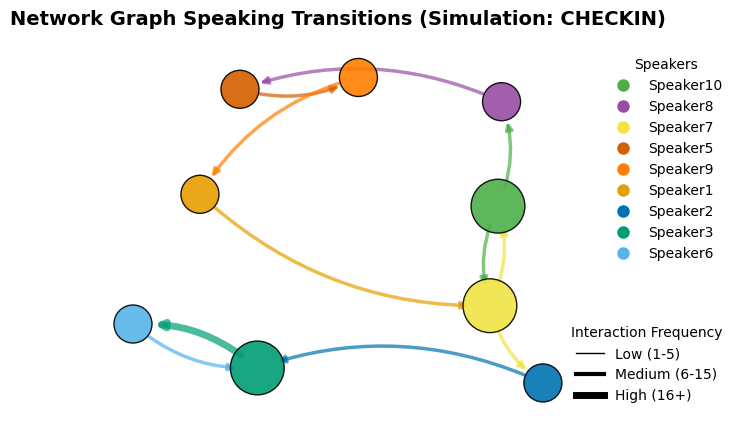
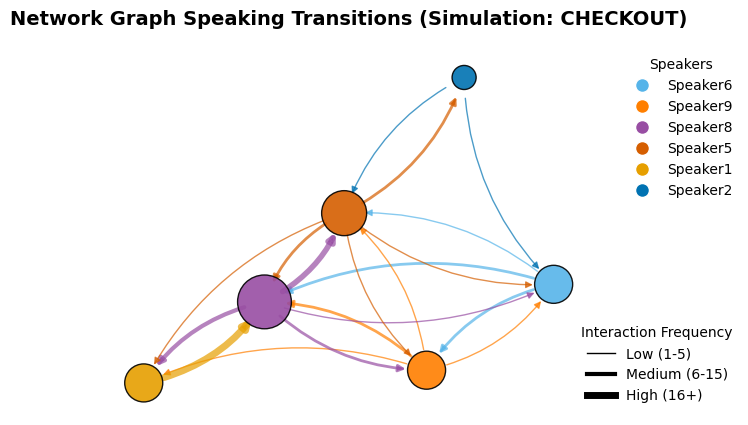
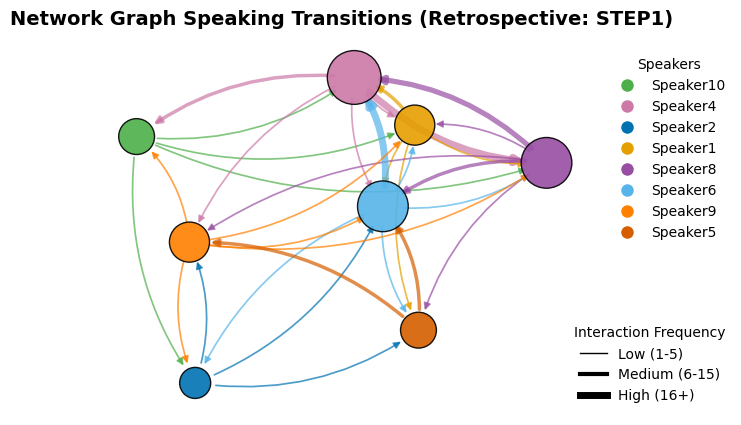
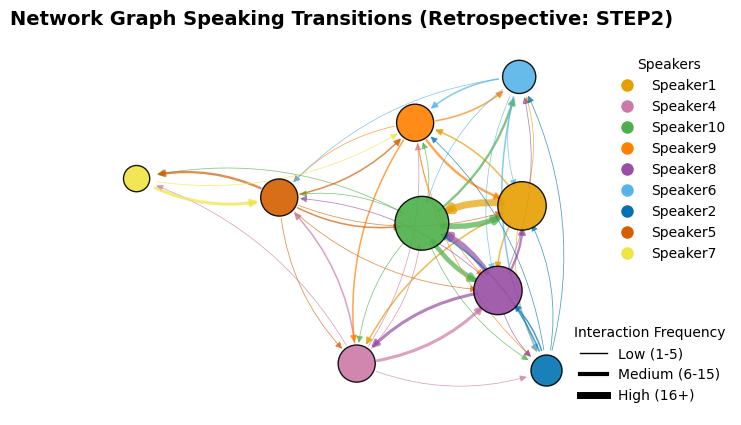
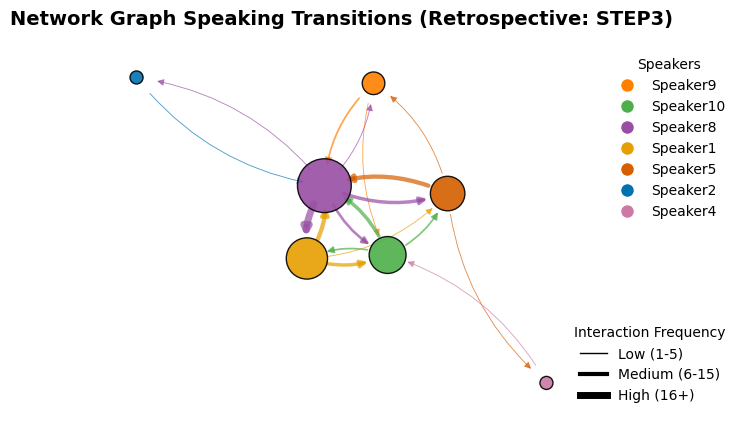
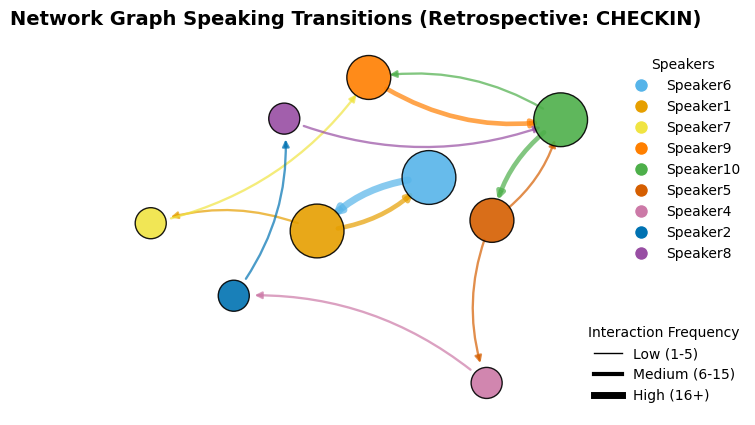
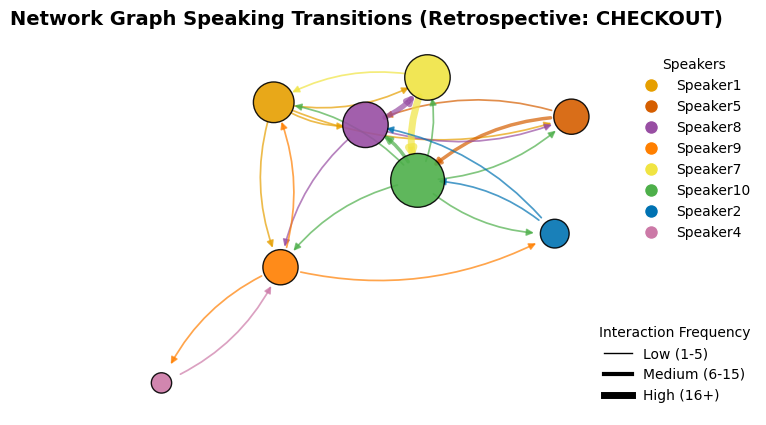
Description: The Network Graph maps the flow of interaction by illustrating who spoke after whom. Each node represents a participant, and the connecting edges show directional exchanges. Larger nodes indicate more speaking activity, while thicker arrows show frequent follow‑on interactions.
Relevance: Interaction patterns offer vital clues about how information flows, how influence is distributed, and how inclusive a team's dynamics are. Research in social network analysis shows that high-performing teams have dense, reciprocal interaction networks where many participants are both contributors and recipients. Sparse or centralized patterns may indicate bottlenecks, communication gaps, or over-reliance on certain individuals. Balanced, distributed networks foster shared understanding and better collective problem-solving—especially under stress or uncertainty.
Interpreting:
- Look for Distribution – Are interactions evenly spread across the team, or concentrated through a few nodes?
- Assess Reciprocity – Are interactions mutual, or do some individuals speak often without being responded to—or vice versa?
- Note Gatekeepers – Are there participants acting as bridges or bottlenecks between sub-groups?
Probing Questions:
- Individual Level
- Was I central or peripheral in the conversation? Why might that have been?
- Did I speak mostly to one person or engage with multiple team members?
- Team Level
- Were there clear clusters or silos in the team's communication?
- Did our network support a free exchange of ideas, or were we overly reliant on a few voices?
Speaking Transition Heatmap Analysis
Expand to read the description, relevance & probing questions
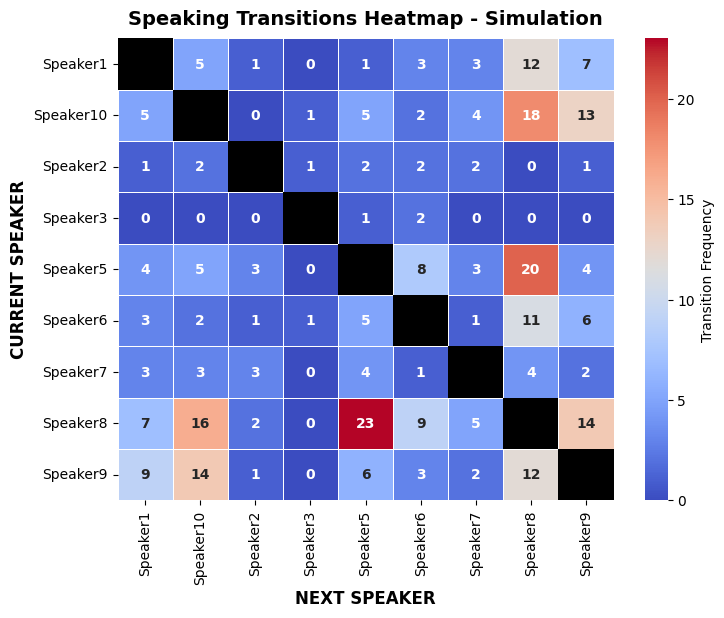
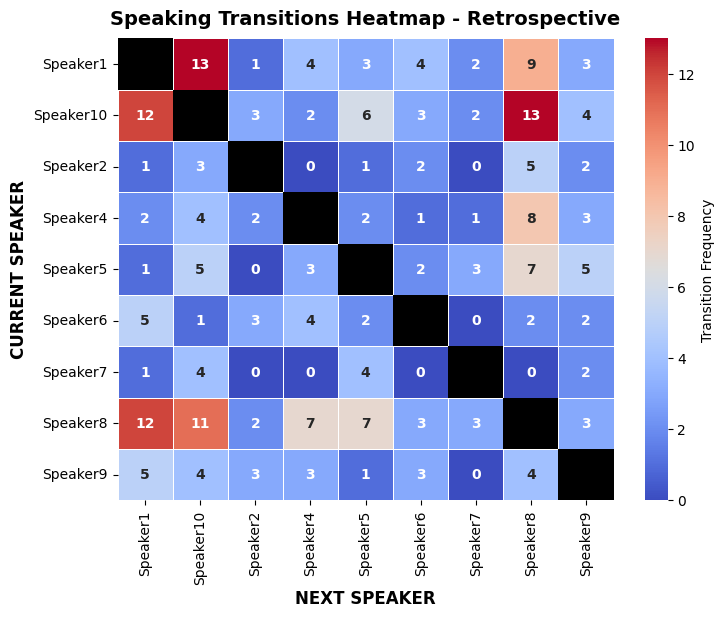
Description: This heatmap shows how often one speaker was followed by another, revealing transition patterns in the flow of conversation. Darker cells indicate frequent transitions between specific individuals.
Relevance: Transition patterns reflect the level of engagement, inclusion, and relational dynamics within a team. Healthy teams tend to have diverse, distributed transitions, meaning multiple members initiate and respond. Repetitive or sparse transitions can point to dominance, silence, or poor hand-offs. This metric offers insight into conversational agility and mutual attention—key ingredients in trust, psychological safety, and collective intelligence.
Interpreting:
- Look for Diversity – Are transitions evenly distributed, or do a few dominate?
- Identify Gaps – Are any team members rarely followed, or never follow others?
- Spot Reciprocity – Are there mutual transitions between pairs, or mostly one‑way?
Probing Questions:
- Individual Level
- Did I engage in dialogue with multiple team members, or just a few?
- Was I intentional in choosing who I directed my responses to?
- Team Level
- Did we build on each other's contributions smoothly, or were there awkward hand-offs or silences?
- What patterns of interaction does this heatmap reveal about inclusion, hierarchy, or decision‑making flow?
Sentiment Analysis
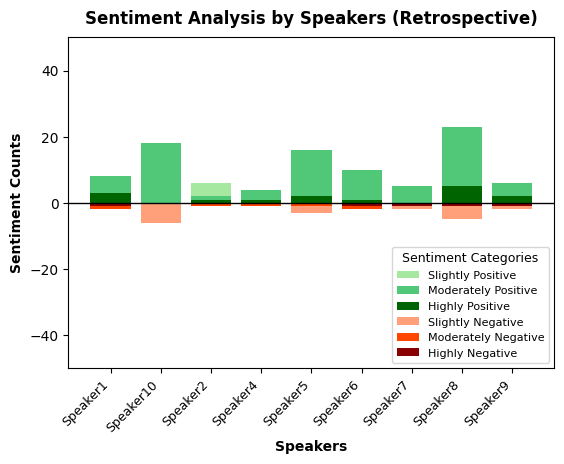
Expand to read the description, relevance & probing questions
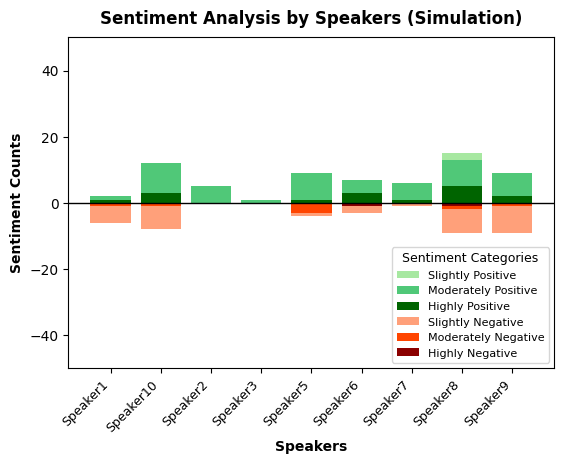
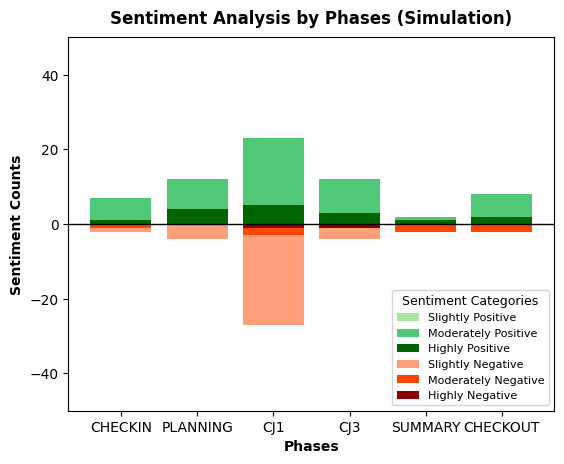
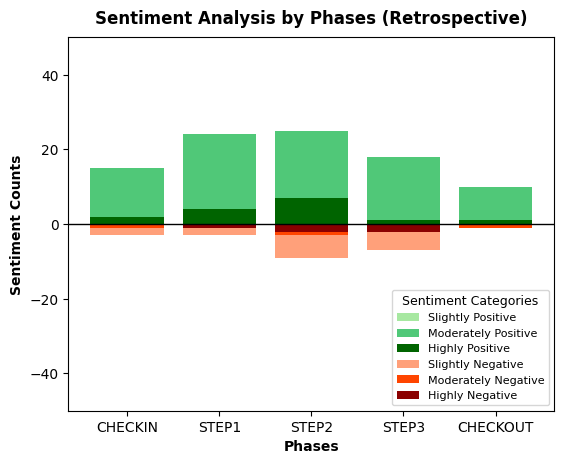
Description: Mirror graphs offer a comparative view of who spoke when—contrasting simulation and retrospective dialogue. The speaker mirror highlights which individuals were most active in each context, while the phase mirror shows how much dialogue occurred during specific stages of the experience.
Relevance: These graphs help reveal whether reflection patterns matched the actual dynamics of the simulation. Teams often under-discuss critical moments or exclude key voices in retrospectives. Mirror graphs help identify these gaps, prompting deeper reflection and inclusion. They also help assess how well teams shared airtime and responsibility across phases of the task.
Interpreting:
- By Speaker: Did individuals who contributed during the simulation also engage in reflection?
- By Phase: Did we spend time reflecting on the most intense or pivotal stages of the simulation?
- Balance: Was there a healthy spread of participation across people and moments—or did focus cluster?
Probing Questions:
- Individual: Did I reflect as actively as I participated in the simulation?
- Team: Did we spend time reflecting on the most important or challenging phases?