Amazonia Link Chart — Stakeholders & Interests
A high-level view of decision-makers, influencers, and affected parties.
This link chart maps the core actors shaping Amazonia Energy Explorations’ crisis response—who holds influence, where accountability lives, and which relationships matter most when decisions must be made quickly. Use it to align your team before working through each Critical Juncture.
Lines show information flow, pressure, or authority. Icons denote role type; flags show national affiliation and ownership stakes. The diagram is not exhaustive, but it captures the most salient relationships for simulation play.
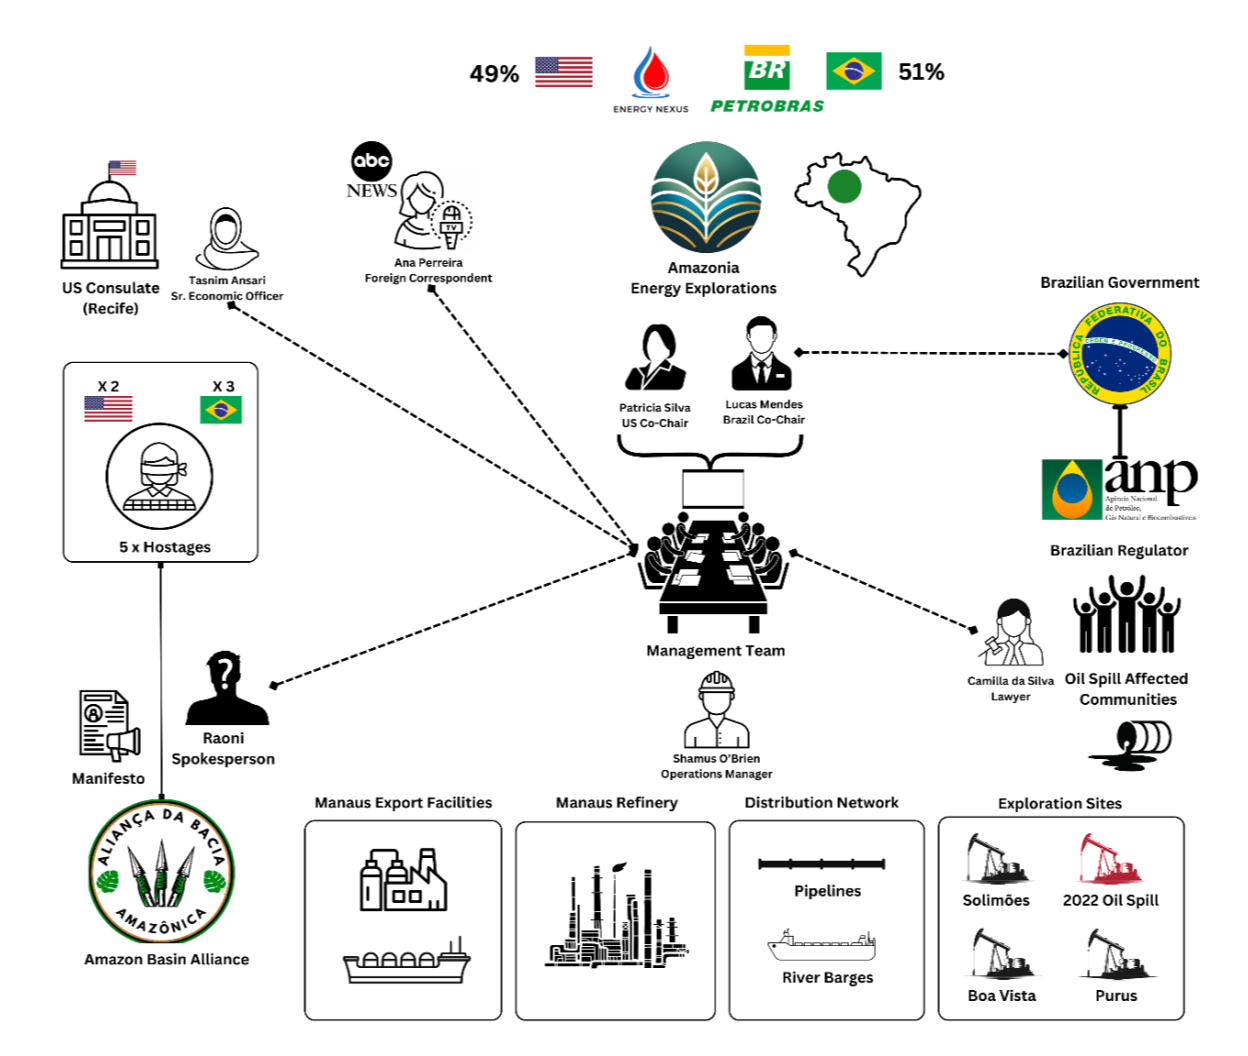
- Company LeadershipUS & Brazil Co-Chairs and the Management Team coordinate operational, legal, and communications decisions.
- Government StakeholdersBrazilian federal authorities set policy; the US Consulate engages diplomatically and protects citizens.
- RegulatorsANP and related agencies oversee safety and compliance—critical to license to operate and penalties.
- Media & Public NarrativesLocal and international journalists shape perception; cadence and accuracy directly influence trust.
- Communities & Civil SocietyOil-spill affected communities and alliances legitimize—or challenge—company actions.
- Hostage ActorsCaptors and intermediaries drive risk and timing in CJ5–CJ6 negotiations.
- Infrastructure & Supply ChainExport terminals, refinery, pipelines, and river barges create real constraints and trade-offs.
CJ1:Operational Challenges
| Rank | Option | Points | Notes |
|---|---|---|---|
| 1 | Option 2 Technology Enhancements / Adoption | 5 | Fastest path to measurable throughput and $/bbl gains with strong subsidy fit. Mature tech lowers downtime and improves recovery factors while strengthening compliance metrics. |
| 2 | Option 1 Operational Process Optimization | 4 | Lean redesign of SOPs/permits-to-work reduces waste and variability. Gains are durable but require change management and a longer realization horizon. |
| 3 | Option 3 Human Resource Development | 3 | Targeted training (control room, maintenance, HSE) cuts human-error losses and builds resilience. Impact lags and requires on-the-job reinforcement. |
| 4 | Option 6 Health & Safety Enhancements | 2 | Upgrades to safety systems and culture reduce incident severity and frequency. Foundational for license to operate but not a direct lever on short-term throughput. |
| 5 | Option 5 Supply Chain Diversification | 1 | Diversifying vendors/logistics reduces single-point failures and volatility. Benefits are indirect to immediate production KPIs and introduce transition frictions. |
| 6 | Option 4 Short-Term Market Flexibility | 0 | Reactive allocation can trim near-term mismatches. It also raises coordination costs and disruption risk without structural efficiency or HSE uplift. |
Evaluation Criteria
| Criterion | Weight | Description | Rationale |
|---|---|---|---|
| Operational ROI & Efficiency | 30% | Quantified impact on production throughput, $/bbl, unplanned downtime, and OPEX variance (pre/post baselines). | Primary driver of value in a margin-constrained context; auditable via KPI deltas. |
| Time-to-Impact | 25% | Elapsed time to safe deployment and first measurable results (P50); gating dependencies and permits accounted for. | Earlier value capture compounds and extends runway during crisis response. |
| Sustainability & Regulatory Fit | 20% | Projected reduction in emissions/spill probability and eligibility for Brazilian incentives/subsidies; audit trail for compliance. | Affects license to operate and total cost through subsidy capture and avoided penalties. |
| Capability Uplift | 15% | Durability of skills; training hours to proficiency; certification coverage; retention risk. | Human capital multiplies technology/process gains and reduces execution variance. |
| Risk & HSE Improvement | 10% | Reduction in incident likelihood/severity; improvement on leading/lagging HSE indicators (e.g., TRIR, near-miss reporting). | Prevents value erosion from incidents and is a non-negotiable baseline. |
Supporting Rationale
-
Option 2 — Technology Enhancements / Adoption5Fastest path to measurable throughput and $/bbl gains with strong subsidy fit. Mature tech lowers downtime and improves recovery factors while strengthening compliance metrics.
-
Option 1 — Operational Process Optimization4Lean redesign of SOPs/permits-to-work reduces waste and variability. Gains are durable but require change management and a longer realization horizon.
-
Option 3 — Human Resource Development3Targeted training (control room, maintenance, HSE) cuts human-error losses and builds resilience. Impact lags and depends on on-the-job reinforcement.
-
Option 6 — Health & Safety Enhancements2Upgrades to safety systems and culture reduce incident severity and frequency. Foundational for license to operate but not a direct lever on short-term throughput.
-
Option 5 — Supply Chain Diversification1Diversifying vendors/logistics reduces single-point failures and volatility. Benefits are indirect to immediate production KPIs and introduce transition frictions.
-
Option 4 — Short-Term Market Flexibility0Reactive allocation can trim near-term mismatches. It also raises coordination costs and disruption risk without structural efficiency or HSE uplift.
CJ2:Oil Leak (Initial Response)
| Rank | Option | Points | Notes |
|---|---|---|---|
| 1 | Option 3 Partial Production Halt | 5 | Isolates the affected area to cut spill drivers while keeping safe capacity online. This yields the best net across environment, safety, and revenue. |
| 2 | Option 2 Gradual Shutdown | 4 | Controlled ramp-down prioritizes safe procedures and equipment care. It leaves a longer exposure window than a targeted partial halt. |
| 3 | Option 6 Rapid Containment Response | 3 | Fastest path to environmental control with decisive action. It increases responder risk and draws heavily on scarce specialists. |
| 4 | Option 4 Impact Assessment Pause | 2 | Improves decision quality by clarifying the spill profile. Risk rises if containment is delayed, so assessments must run parallel to mitigation. |
| 5 | Option 5 Security Assessment | 1 | Addresses vulnerabilities to prevent recurrence. It offers limited immediate spill control and diverts focus during the acute phase. |
Evaluation Criteria
| Criterion | Weight | Description | Rationale |
|---|---|---|---|
| Environmental Containment Effectiveness | 30% | Time to first containment and probability of spread reduction (boom capture %, shoreline impact). | Minimizes irreversible environmental harm and fines. |
| Personnel Safety | 25% | Responder exposure, TRIR impact, hot-zone protocols followed. | Prevents compounding the incident with casualties. |
| Operational Continuity | 20% | Barrels preserved in unaffected units without cross-contamination risk. | Preserves revenue while source control proceeds. |
| Speed & Control of Execution | 15% | SOP clarity, step risk, command span, and control points. | Reduces error probability under stress. |
| Resource Efficiency | 10% | Specialist team/equipment diversion and opportunity cost. | Avoids crippling broader operations during response. |
Supporting Rationale
- Option 3 — Partial Production Halt5Isolates the affected area to cut spill drivers while keeping safe capacity online. This yields the best net across environment, safety, and revenue.
- Option 2 — Gradual Shutdown4Controlled ramp-down prioritizes safe procedures and equipment care. It leaves a longer exposure window than a targeted partial halt.
- Option 6 — Rapid Containment Response3Fastest path to environmental control with decisive action. It increases responder risk and draws heavily on scarce specialists.
- Option 4 — Impact Assessment Pause2Improves decision quality by clarifying the spill profile. Risk rises if containment is delayed, so assessments must run parallel to mitigation.
- Option 5 — Security Assessment1Addresses vulnerabilities to prevent recurrence. It offers limited immediate spill control and diverts focus during the acute phase.
CJ3:Crisis Communications
| Rank | Option | Points | Notes |
|---|---|---|---|
| 1 | Option 6 Transparent Communication | 5 | Cadence-based updates with verifiable facts build trust and reduce speculation. This maintains narrative control while meeting stakeholder expectations. |
| 2 | Option 4 Interview with Brazilian Journalist (New Contact) | 4 | Local outlets add credibility and reach into affected communities. The move signals openness and respect for local perspectives. |
| 3 | Option 3 Interview with Ana Pereira from ABC (Existing Contact) | 3 | A familiar platform enables detailed messaging and follow-ups. Perceived partiality or the journalist’s agenda can narrow audience acceptance. |
| 4 | Option 2 Issue a Prepared Statement | 2 | A vetted statement reduces missteps under pressure. It lacks interactivity and can appear scripted in a fast-moving crisis. |
| 5 | Option 5 Wait Until All Facts are Clear | 1 | Delaying communication creates an information vacuum that fosters negative narratives. Trust decays quickly when silence replaces updates. |
| 6 | Option 1 Hold a News Conference | 0 | Live Q&A without full command of facts exposes gaps and risk. Missteps under pressure can worsen the situation. |
Evaluation Criteria
| Criterion | Weight | Description | Rationale |
|---|---|---|---|
| Transparency & Stakeholder Engagement | 30% | Frequency, specificity, and verifiability of updates to communities, regulators, partners, and media. | Prevents rumor vacuums and builds trust capital. |
| Narrative Control & Credibility | 25% | Lead with facts; third-party corroboration; consistency across channels. | Own the story or someone else will. |
| Accuracy & Legal Risk | 15% | Error rate, corrections protocol, regulatory exposure. | Avoids secondary crises caused by misstatements. |
| Community & Local Relations | 15% | Salience for Brazilian audiences; cultural appropriateness; local media access. | Restores social license where impact is felt. |
| Commercial Impact | 15% | Investor/customer confidence, counter-party reassurance. | Maintains market and partner optionality during response. |
Supporting Rationale
- Option 6 — Transparent Communication5Cadence-based updates with verifiable facts build trust and reduce speculation. This maintains narrative control while meeting stakeholder expectations.
- Option 4 — Interview with Brazilian Journalist (New Contact)4Local outlets add credibility and reach into affected communities. The move signals openness and respect for local perspectives.
- Option 3 — Interview with Ana Pereira from ABC (Existing Contact)3A familiar platform enables detailed messaging and follow-ups. Perceived partiality or the journalist’s agenda can narrow audience acceptance.
- Option 2 — Issue a Prepared Statement2A vetted statement reduces missteps under pressure. It lacks interactivity and can appear scripted in a fast-moving crisis.
- Option 5 — Wait Until All Facts are Clear1Delaying communication creates an information vacuum that fosters negative narratives. Trust decays quickly when silence replaces updates.
- Option 1 — Hold a News Conference0Live Q&A without full command of facts exposes gaps and risk. Missteps under pressure can worsen the situation.
CJ4:Oil Spill Containment
| Rank | Option | Points | Notes |
|---|---|---|---|
| 1 | Option 4 Bioremediation Barriers | 5 | Sustainable barriers both contain and accelerate natural breakdown of pollutants. The approach signals ecological stewardship and earns reputation benefits. |
| 2 | Option 3 Containment Booms | 4 | A proven first-line measure that quickly limits spread. It protects sensitive zones and buys time for cleanup. |
| 3 | Option 5 Temporary Absorbent Marshlands | 2 | Nature-based absorption adds capacity and protects aquatic ecosystems. It demands planning and resources that limit rapid deployment. |
| 4 | Option 2 Aerial Surveillance | 0 | Aids assessment and targeting by mapping the spill’s footprint. As an indirect measure it doesn’t contain oil by itself. |
Evaluation Criteria
| Criterion | Weight | Description | Rationale |
|---|---|---|---|
| Containment Efficacy | 35% | Modeled capture/neutralization %, shoreline protection score. | Direct environmental risk reduction. |
| Deployment Speed & Reliability | 20% | Mobilization time, weather-window robustness, failure modes. | Time is the enemy of containment. |
| Sustainability & Restoration Value | 20% | Long-term ecological benefit beyond immediate control. | Aligns with stewardship commitments. |
| Feasibility & Availability | 15% | Vendor availability, spares, logistics complexity. | Plan must be executable within constraints. |
| Cost & Complexity | 10% | CAPEX/OPEX and operational burden. | Avoid solutions that consume capacity without commensurate benefit. |
Supporting Rationale
- Option 4 — Bioremediation Barriers5Sustainable barriers both contain and accelerate natural breakdown of pollutants. The approach signals ecological stewardship and earns reputation benefits.
- Option 3 — Containment Booms4A proven first-line measure that quickly limits spread. It protects sensitive zones and buys time for cleanup.
- Option 5 — Temporary Absorbent Marshlands2Nature-based absorption adds capacity and protects aquatic ecosystems. It demands planning and resources that limit rapid deployment.
- Option 2 — Aerial Surveillance0Aids assessment and targeting by mapping the spill’s footprint. As an indirect measure it doesn’t contain oil by itself.
CJ5:Hostage Taking (Initial Response)
| Rank | Option | Points | Notes |
|---|---|---|---|
| 1 | Option 3 Engage Crisis Negotiation Team | 5 | Deploying trained negotiators stabilizes the situation and opens a structured dialogue. It maximizes hostage safety while preserving future tactical options. |
| 2 | Option 5 Demand Proof of Life | 4 | Verification provides critical information for pacing and tactics. It should occur early but always within a broader negotiation plan. |
| 3 | Option 2 Community Mediation | 3 | Local intermediaries can reduce hostility and miscommunication. Effectiveness varies widely and command control is weaker. |
| 4 | Option 4 Leverage Brazilian Co-Chair | 2 | Personal influence can open unique channels. Role conflict and personal safety concerns limit its use as a primary tool. |
| 5 | Option 1 Diplomatic Channels | 1 | State-level engagement can add pressure and resources. It is typically slower and less effective for immediate stabilization. |
| 6 | Option 6 Crisis Communications Strategy | 0 | Communications protect reputation and morale. They do not directly improve hostage safety or contact quality in the first hours. |
Evaluation Criteria
| Criterion | Weight | Description | Rationale |
|---|---|---|---|
| Hostage Safety Preservation | 35% | Effect on probability of harm; de-escalation potential. | First principle: protect life. |
| Probability of Constructive Contact | 25% | Likelihood of establishing stable, secure negotiation channels. | Dialogue is the path to resolution. |
| Time to Stabilize | 15% | Speed at which volatility and uncertainty decrease. | Buys time for better options. |
| Coordination with Authorities | 15% | Alignment with law-enforcement/consular SOPs. | Prevents jurisdictional friction and mixed signals. |
| Public/Stakeholder Signal | 10% | External optics without escalation. | Maintains morale and trust without provoking actors. |
Supporting Rationale
- Option 3 — Engage Crisis Negotiation Team5Deploying trained negotiators stabilizes the situation and opens a structured dialogue. It maximizes hostage safety while preserving future tactical options.
- Option 5 — Demand Proof of Life4Verification provides critical information for pacing and tactics. It should occur early but always within a broader negotiation plan.
- Option 2 — Community Mediation3Local intermediaries can reduce hostility and miscommunication. Effectiveness varies widely and command control is weaker.
- Option 4 — Leverage Brazilian Co-Chair2Personal influence can open unique channels. Role conflict and personal safety concerns limit its use as a primary tool.
- Option 1 — Diplomatic Channels1State-level engagement can add pressure and resources. It is typically slower and less effective for immediate stabilization.
- Option 6 — Crisis Communications Strategy0Communications protect reputation and morale. They do not directly improve hostage safety or contact quality in the first hours.
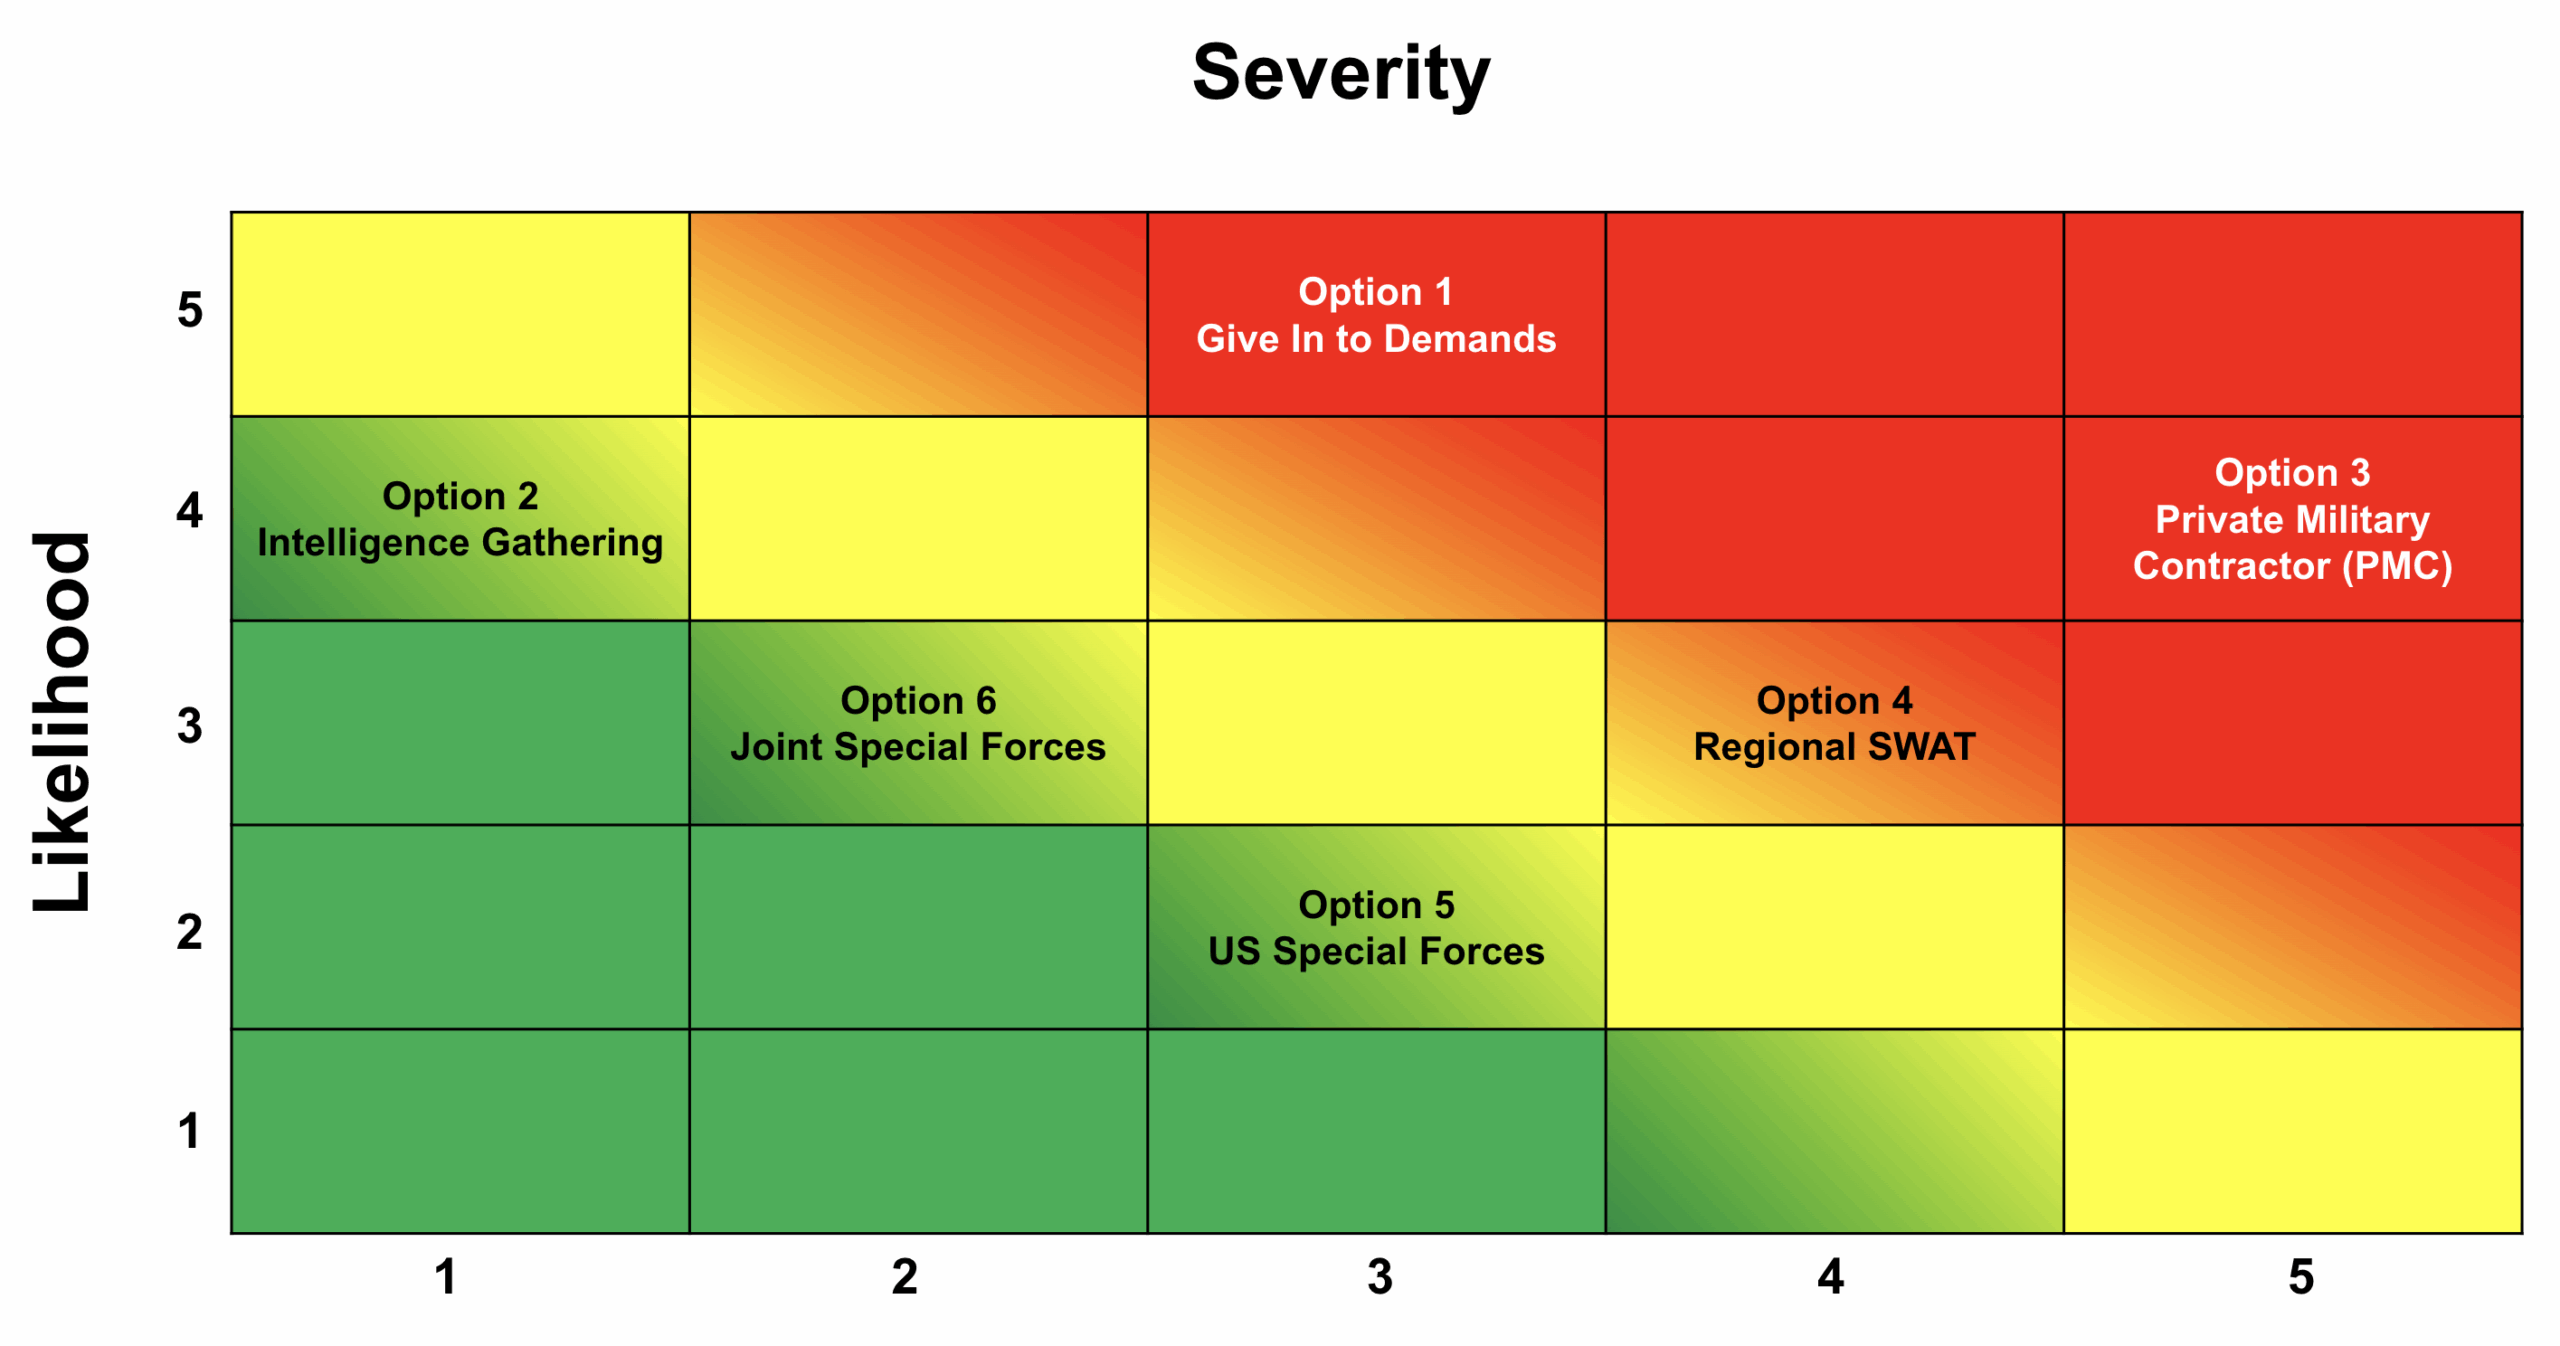
CJ6:Hostage Taking Resolution
| Rank | Option | Points | Notes |
|---|---|---|---|
| 1 | Option 2 Intelligence Gathering Operation | 5 | Intelligence-first actions reduce uncertainty and directly lower immediate risk to hostages. They also enable non-violent outcomes or precisely targeted interventions. |
| 2 | Option 6 Joint Special Operations (US & Brazil) | 4 | Combined capability increases planning depth and execution quality. Setup time and cross-border coordination extend the exposure window. |
| 3 | Option 5 US Special Operations | 3 | Elite teams bring decisive skills for complex rescues. Jurisdictional constraints and unfamiliar terrain elevate risk and delay deployment. |
| 4 | Option 4 Regional SWAT | FAIL | Local units can move fast but are less specialized for hostage scenarios. Escalation risk and training gaps threaten hostage safety. |
| 5 | Option 1 Give in to Demands | FAIL | Meeting demands may not guarantee safety or release. It encourages future abductions and severely undermines deterrence. |
| 6 | Option 3 Private Military Contractor (PMC) | FAIL | PMCs can deploy rapidly with local knowledge. Variable standards and accountability increase the chance of violence and collateral harm. |
Evaluation Criteria
| Criterion | Weight | Description | Rationale |
|---|---|---|---|
| Risk to Hostages (Likelihood × Severity) | 40% | Modeled casualty/trauma risk during and immediately after action. | Dominant ethical and strategic consideration. |
| Intelligence Advantage | 20% | Clarity on location, captor capability/intent, and environment. | Information superiority reduces surprises and blue-on-blue risk. |
| Operational Feasibility & Coordination | 15% | Inter-agency/international synchronization, command/control integrity. | Complex operations fail at seams and handoffs. |
| Time to Effect | 15% | Set-up/launch latency vs. deterioration risk. | Windows close quickly; speed must be balanced with risk. |
| Diplomatic/Legal Consequences | 10% | Sovereignty, rules of engagement, and long-tail legal exposure. | Preserves future operating environment and partnerships. |
Supporting Rationale
-
5 Option 2 — Intelligence Gathering Operation LOW–MODERATEIntelligence-first actions reduce uncertainty and directly lower immediate risk to hostages. They also enable non-violent outcomes or precisely targeted interventions.
-
4 Option 6 — Joint Special Operations (US & Brazil) LOW–MODERATE (time HIGH)Combined capability increases planning depth and execution quality. Setup time and cross-border coordination extend the exposure window.
-
3 Option 5 — US Special Operations MODERATEElite teams bring decisive skills for complex rescues. Jurisdictional constraints and unfamiliar terrain elevate risk and delay deployment.
-
FAIL Option 4 — Regional SWAT MODERATE–HIGHLocal units can move fast but are less specialized for hostage scenarios. Escalation risk and training gaps threaten hostage safety.
-
FAIL Option 1 — Give in to Demands HIGHMeeting demands may not guarantee safety or release. It encourages future abductions and severely undermines deterrence.
-
FAIL Option 3 — Private Military Contractor (PMC) HIGHPMCs can deploy rapidly with local knowledge. Variable standards and accountability increase the chance of violence and collateral harm.
Risk Assessment Matrix (common to all outcomes):
CJ7A:Salvage Amazonia
| Rank | Option | Points | Notes |
|---|---|---|---|
| 1 | Option 4 Diversify and Rebrand | 5 | Repositioning reduces risk concentration and opens sustainable growth lanes. It also supports reputation repair with a credible strategic shift. |
| 2 | Option 2 International Solution | 4 | Global partners bring technology, funding, and know-how to raise capability. This spreads geopolitical and operational risk while improving resilience. |
| 3 | Option 1 Full Restoration | 3 | A comprehensive environmental and community program addresses harms directly. Cost and timeline are significant but ethically and reputationally valuable. |
| 4 | Option 4 (Alt) Transparency Focus | 2 | Radical openness rebuilds stakeholder trust and reduces rumor. Without structural changes, it cannot fully solve the strategic problems. |
| 5 | Option 5 Divest and Exit | 1 | An orderly exit cuts exposure and stabilizes near-term finances. It surrenders future upside and may be seen as walking away from obligations. |
| 6 | Option 6 Stay the Course | FAIL | Continuing status quo leaves root issues unaddressed. It increases the probability of repeat crises and reputational decline. |
Evaluation Criteria
| Criterion | Weight | Description | Rationale |
|---|---|---|---|
| Long-Term Strategic Viability | 30% | Five-year competitiveness, adjacency access, resilience to policy/price shocks. | Prevents recurrence and positions for growth. |
| Reputation & Social License | 20% | Trust with communities/regulators; ESG rating trajectory. | Determines permission to operate and partner. |
| Environmental Impact | 20% | Depth of remediation and avoided future harm. | Closes the loop on the crisis with tangible outcomes. |
| Financial Outcome (5yr) | 20% | NPV/cash recovery, liquidity path, capital intensity. | Ensures solvency while investing in change. |
| Execution Feasibility | 10% | Partner availability, capital access, org readiness. | Ambition without capacity is risk. |
Supporting Rationale
- Option 4 — Diversify and Rebrand5Repositioning reduces risk concentration and opens sustainable growth lanes. It also supports reputation repair with a credible strategic shift.
- Option 2 — International Solution4Global partners bring technology, funding, and know-how to raise capability. This spreads geopolitical and operational risk while improving resilience.
- Option 1 — Full Restoration3A comprehensive environmental and community program addresses harms directly. Cost and timeline are significant but ethically and reputationally valuable.
- Option 4 (Alt) — Transparency Focus2Radical openness rebuilds stakeholder trust and reduces rumor. Without structural changes, it cannot fully solve the strategic problems.
- Option 5 — Divest and Exit1An orderly exit cuts exposure and stabilizes near-term finances. It surrenders future upside and may be seen as walking away from obligations.
- Option 6 — Stay the CourseFAILContinuing status quo leaves root issues unaddressed. It increases the probability of repeat crises and reputational decline.
CJ7B:Navigating Crisis with Failure
| Rank | Option | Points | Notes |
|---|---|---|---|
| 1 | Option 3 Ethical Closure and Environmental Restoration | 5 | Centering remediation demonstrates accountability and respect for affected communities. While expensive, it delivers the strongest reputational recovery. |
| 2 | Option 5 Asset Donation and Community Initiatives | 4 | Transferring assets can create durable local benefits and goodwill. Legal diligence is essential to avoid unintended liabilities. |
| 3 | Option 4 Contractual Commitment Fulfillment | 3 | Honoring commitments preserves credibility with partners and regulators. It may require reserved funds and careful sequencing to avoid defaults. |
| 4 | Option 2 Employee Transition and Severance | 2 | Supporting workers through placement and severance reduces harm and reputational risk. The cost and administrative effort are non-trivial. |
| 5 | Option 1 Orderly Asset Liquidation and Debt Settlement | 1 | A structured wind-down protects creditor recovery and minimizes chaos. Without remediation, it can still be perceived as prioritizing money over people. |
Evaluation Criteria
| Criterion | Weight | Description | Rationale |
|---|---|---|---|
| Ethical Responsibility & Environmental Restoration | 30% | Credible remediation scope, speed, and third-party verification. | Upholds obligations despite exit. |
| Legal Risk Mitigation | 20% | Residual liabilities, litigation exposure, regulatory posture. | Cleaner exit reduces long-tail drag. |
| Stakeholder Equity | 20% | Fair treatment of communities, employees, creditors. | Protects relationships and future optionality. |
| Financial Orderliness | 15% | Debt settlement, asset value preservation, wind-down cost control. | Avoids disorderly collapse costs. |
| Feasibility & Timeline | 15% | Practicality under time pressure; execution risk. | Plans must survive contact with reality. |
Supporting Rationale
- Option 3 — Ethical Closure and Environmental Restoration5Centering remediation demonstrates accountability and respect for affected communities. While expensive, it delivers the strongest reputational recovery.
- Option 5 — Asset Donation and Community Initiatives4Transferring assets can create durable local benefits and goodwill. Legal diligence is essential to avoid unintended liabilities.
- Option 4 — Contractual Commitment Fulfillment3Honoring commitments preserves credibility with partners and regulators. It may require reserved funds and careful sequencing to avoid defaults.
- Option 2 — Employee Transition and Severance2Supporting workers through placement and severance reduces harm and reputational risk. The cost and administrative effort are non-trivial.
- Option 1 — Orderly Asset Liquidation and Debt Settlement1A structured wind-down protects creditor recovery and minimizes chaos. Without remediation, it can still be perceived as prioritizing money over people.